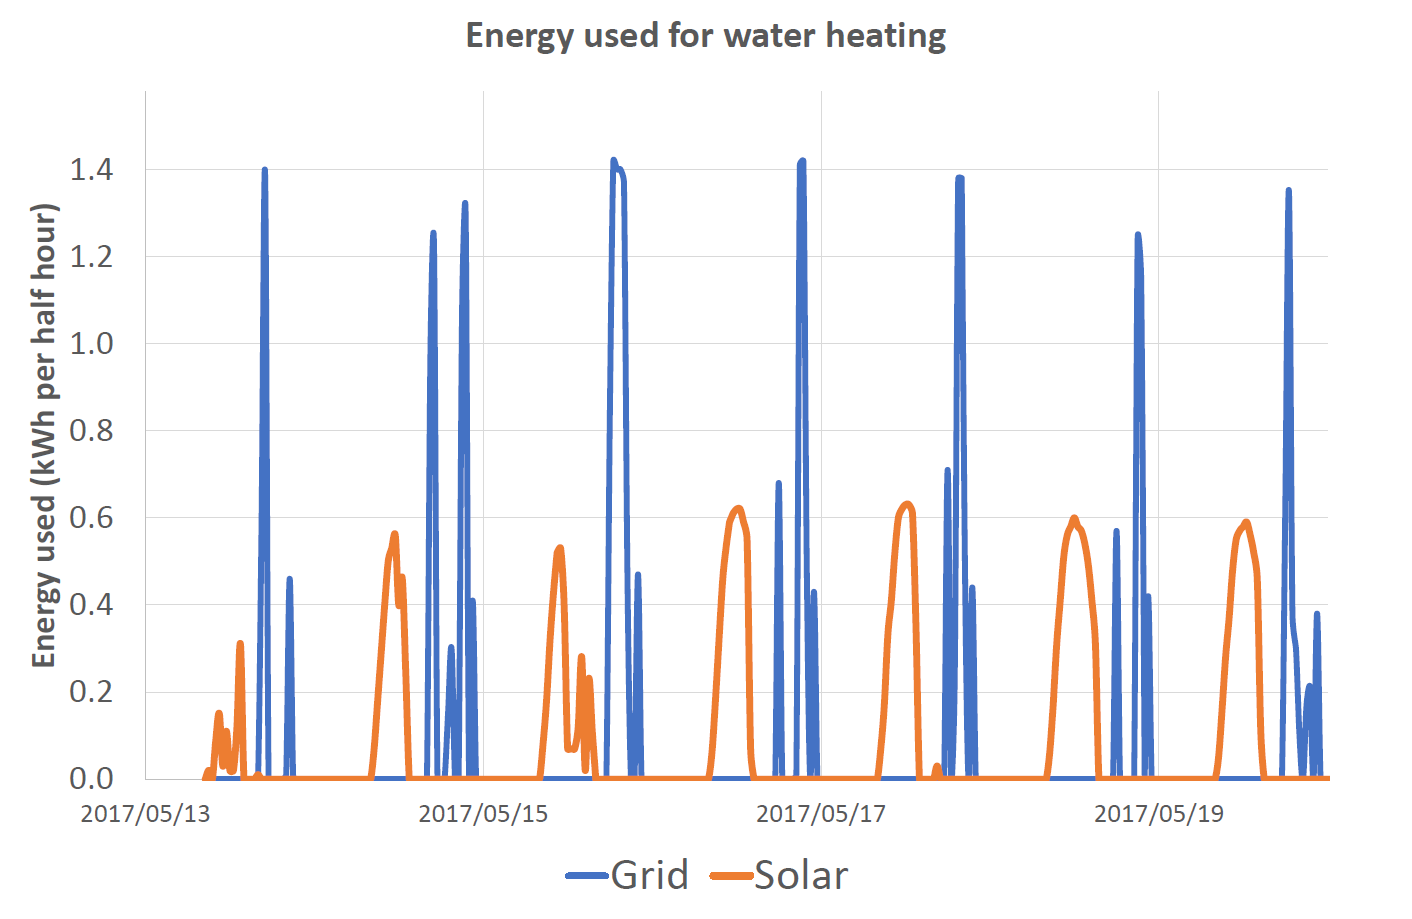
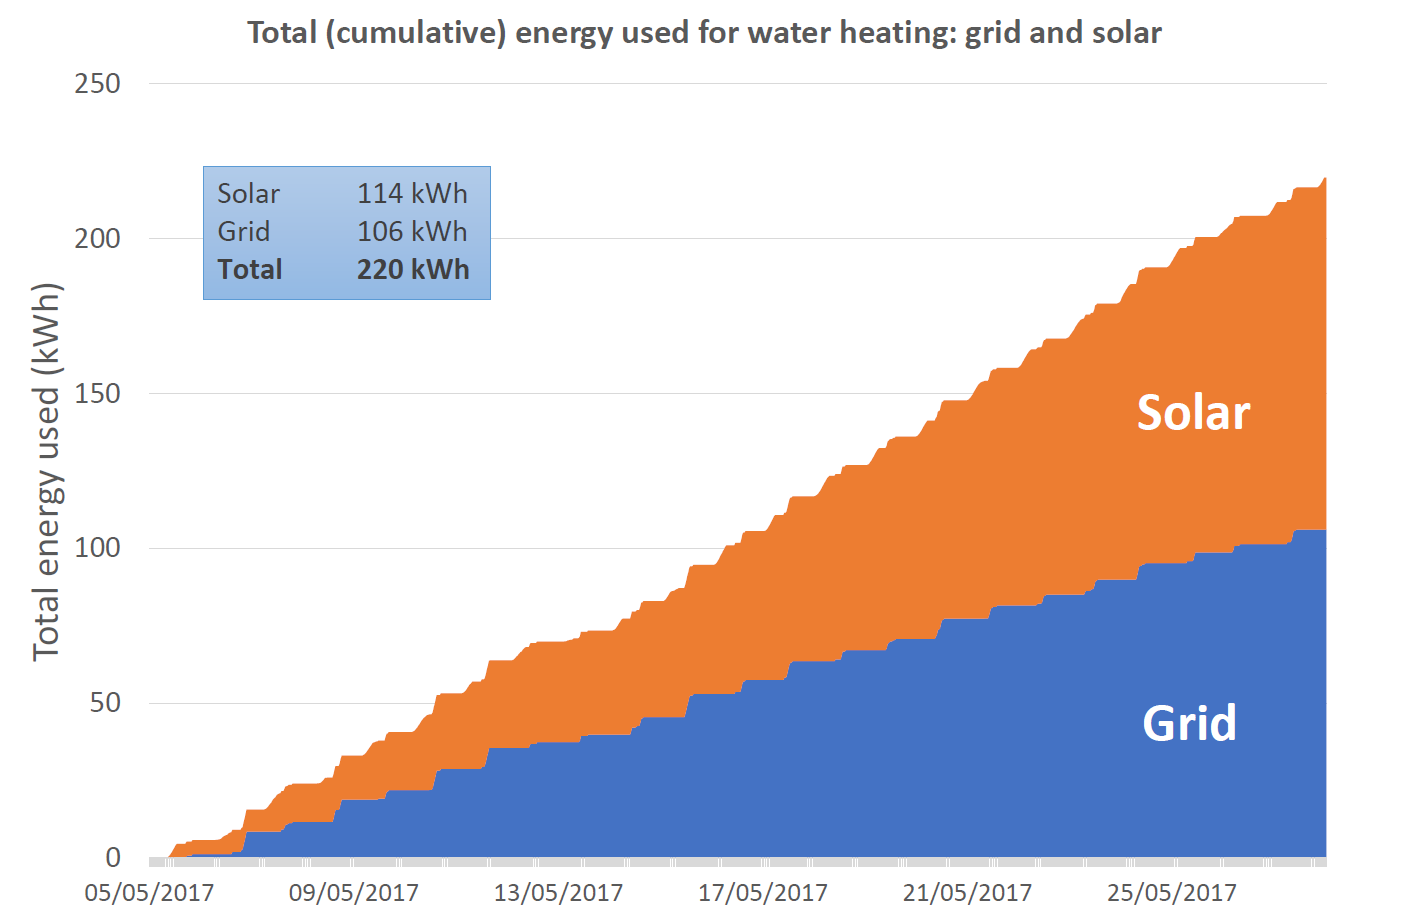
Solar PV array size: 1.575 kWp Family size: 4 people Solar Fraction achieved: 52% of energy from the sun
When & Where: Pretoria, May 2017 (Winter)
Comments: With a system of less than 1.6 kWp for four people, over 50% of the family’s water heating energy was obtained from the sun in winter time.
 |  |
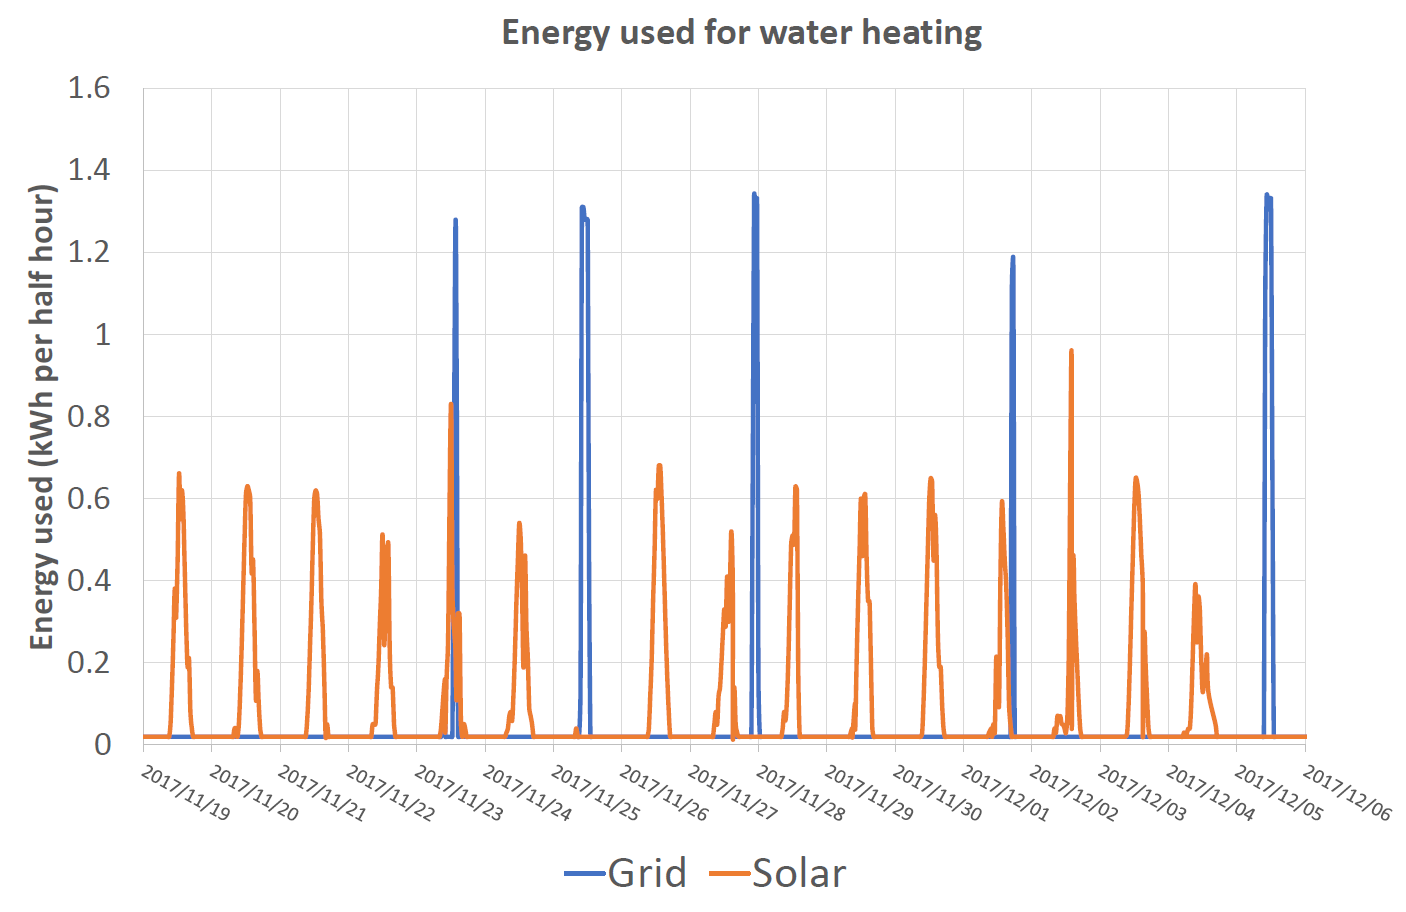
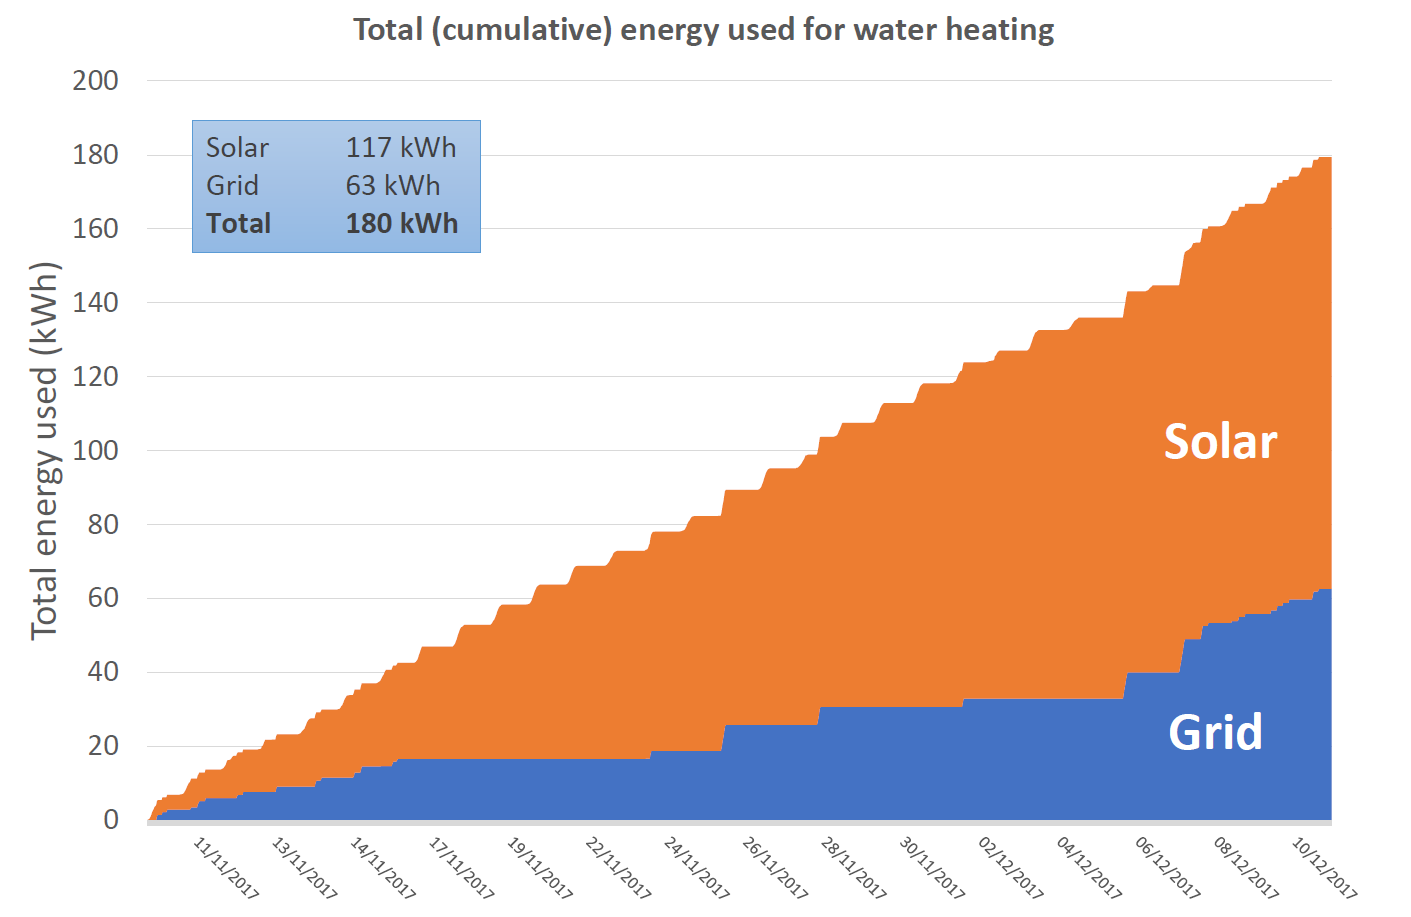
Solar PV array size: 1.5 kWp Family size: 2 people Solar Fraction achieved: 65% of energy from the sun
When & Where: Johannesburg, November to December 2017 (Summer)
Comments: Approximately two-thirds of this family’s water heating energy need was obtained from the sun.
 |  |
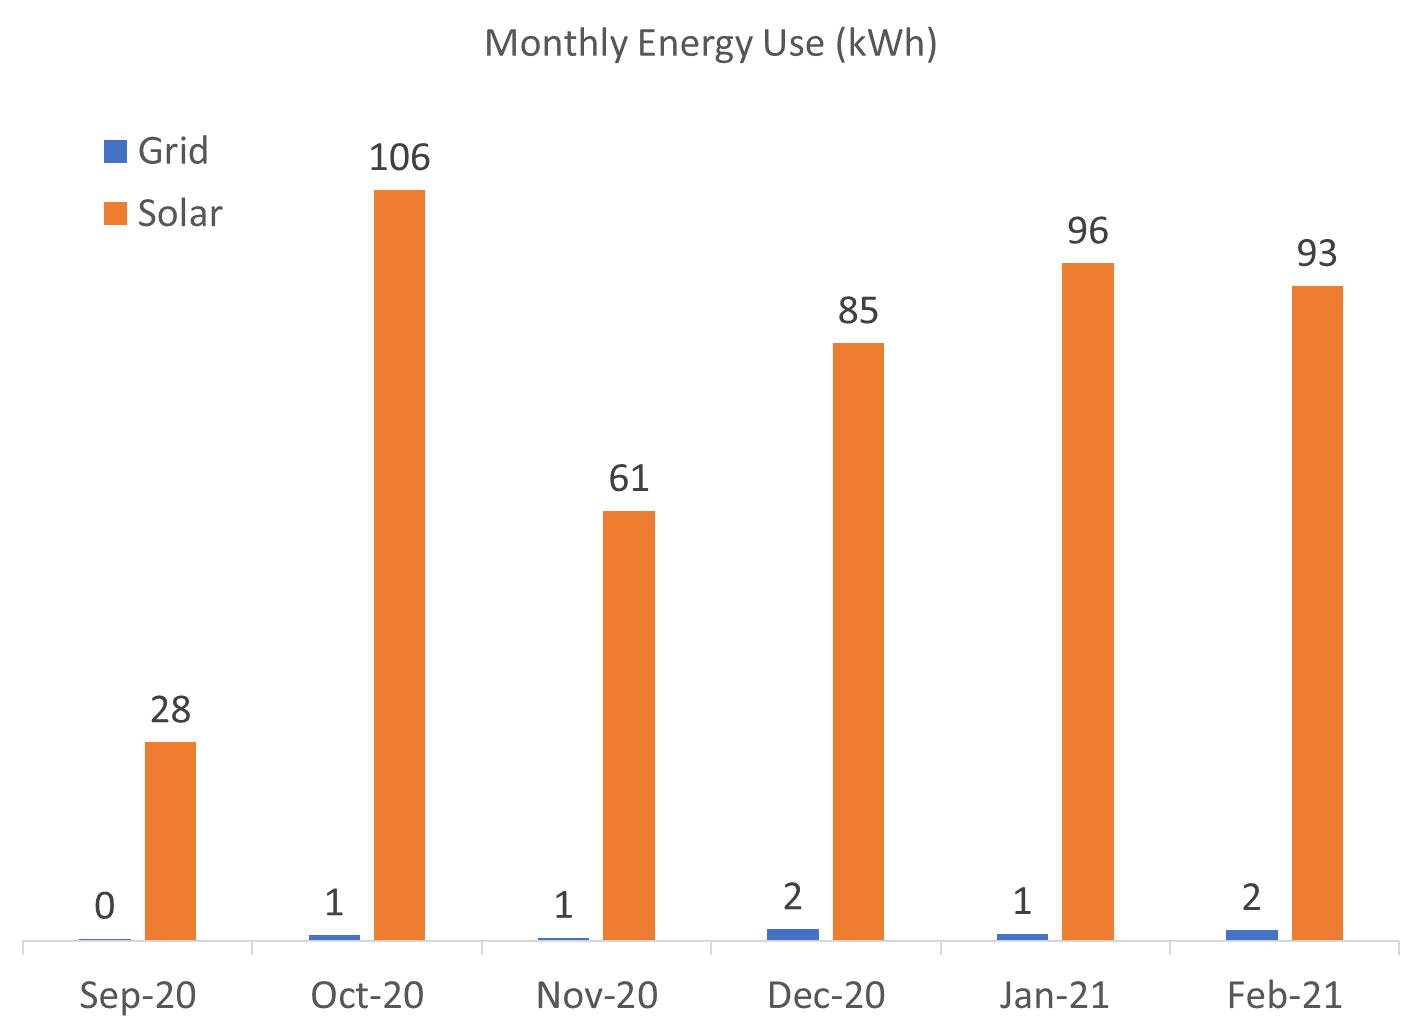
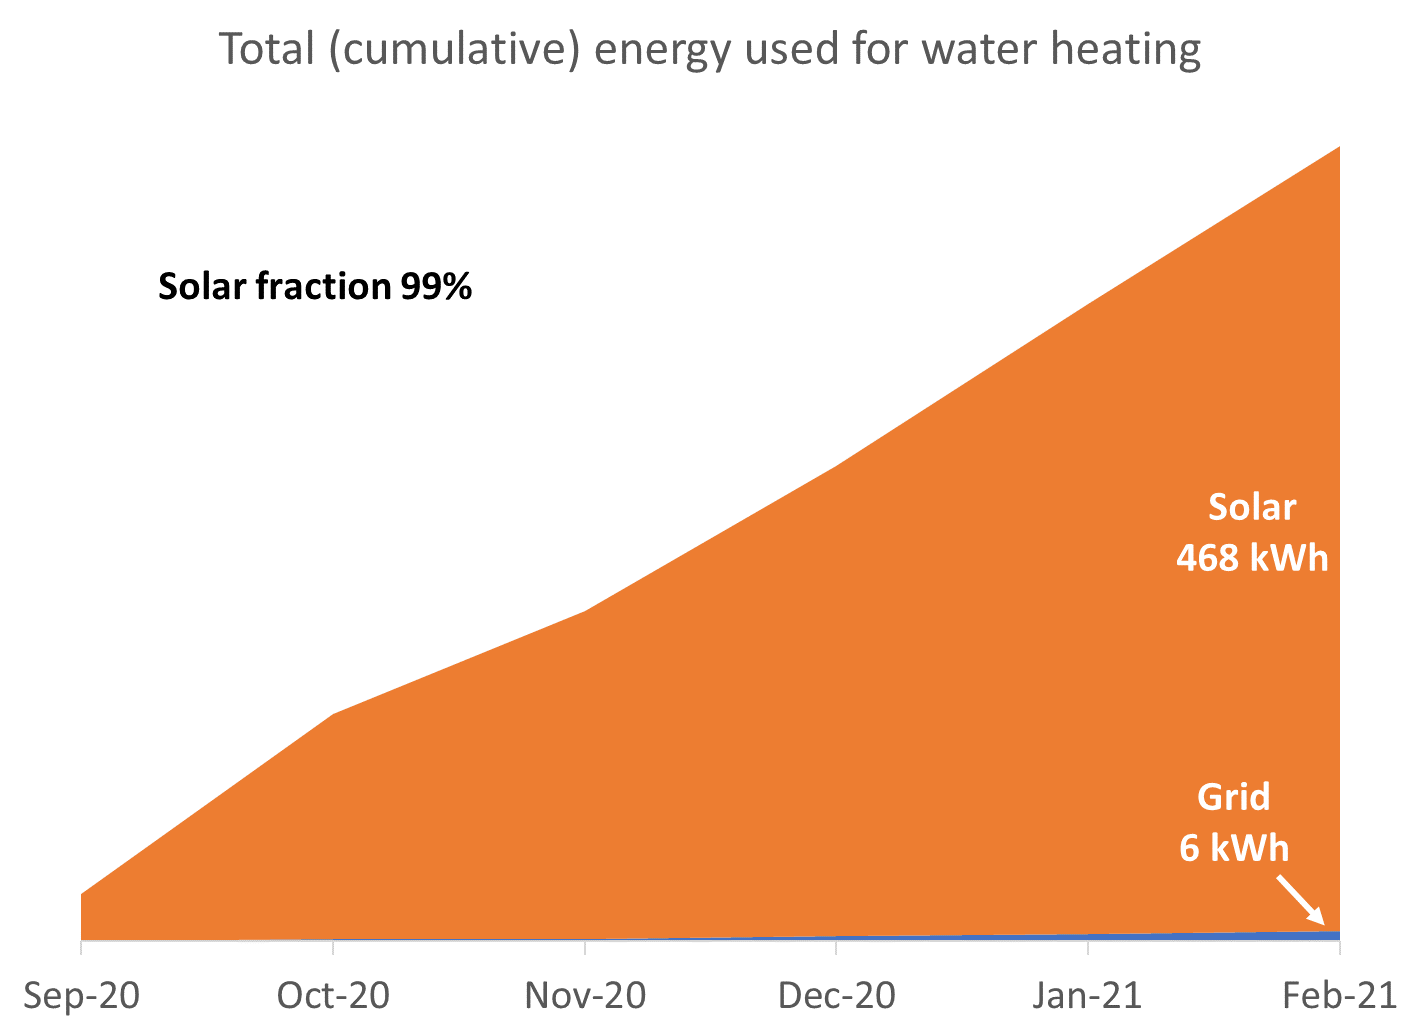
Solar PV array size: 1.8 kWp Family size: 1 person plus domestic worker Solar Fraction achieved: 99% of energy from the sun
When & Where: Cape Town, October 2020 to February 2021 (Summer)
Comments: All of this household’s water heating energy need was obtained from the sun.
 |  |
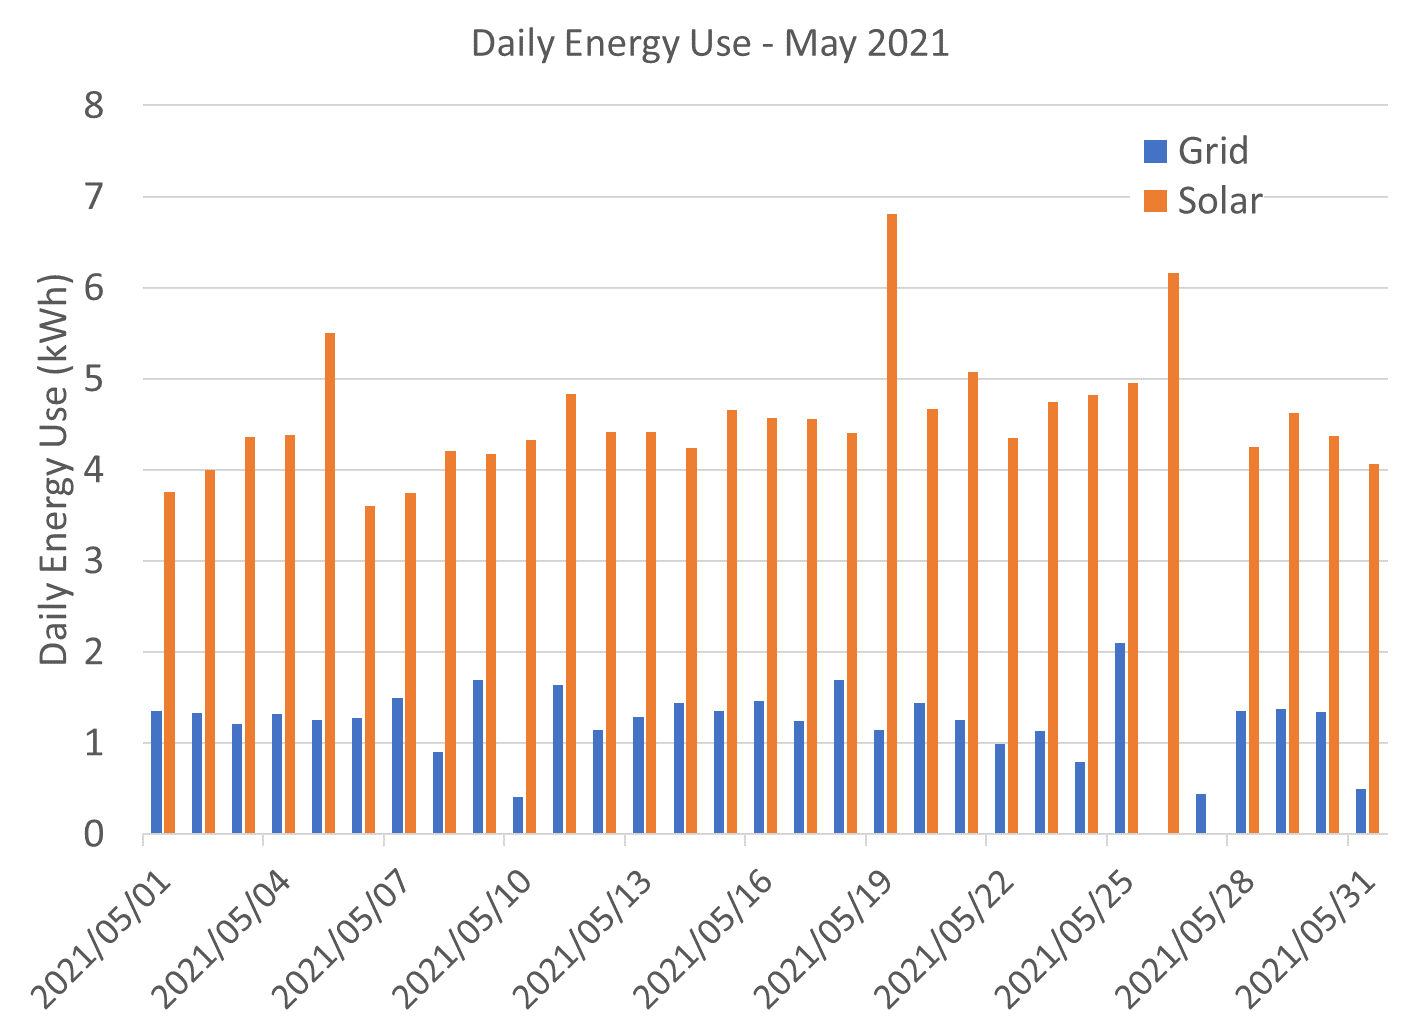
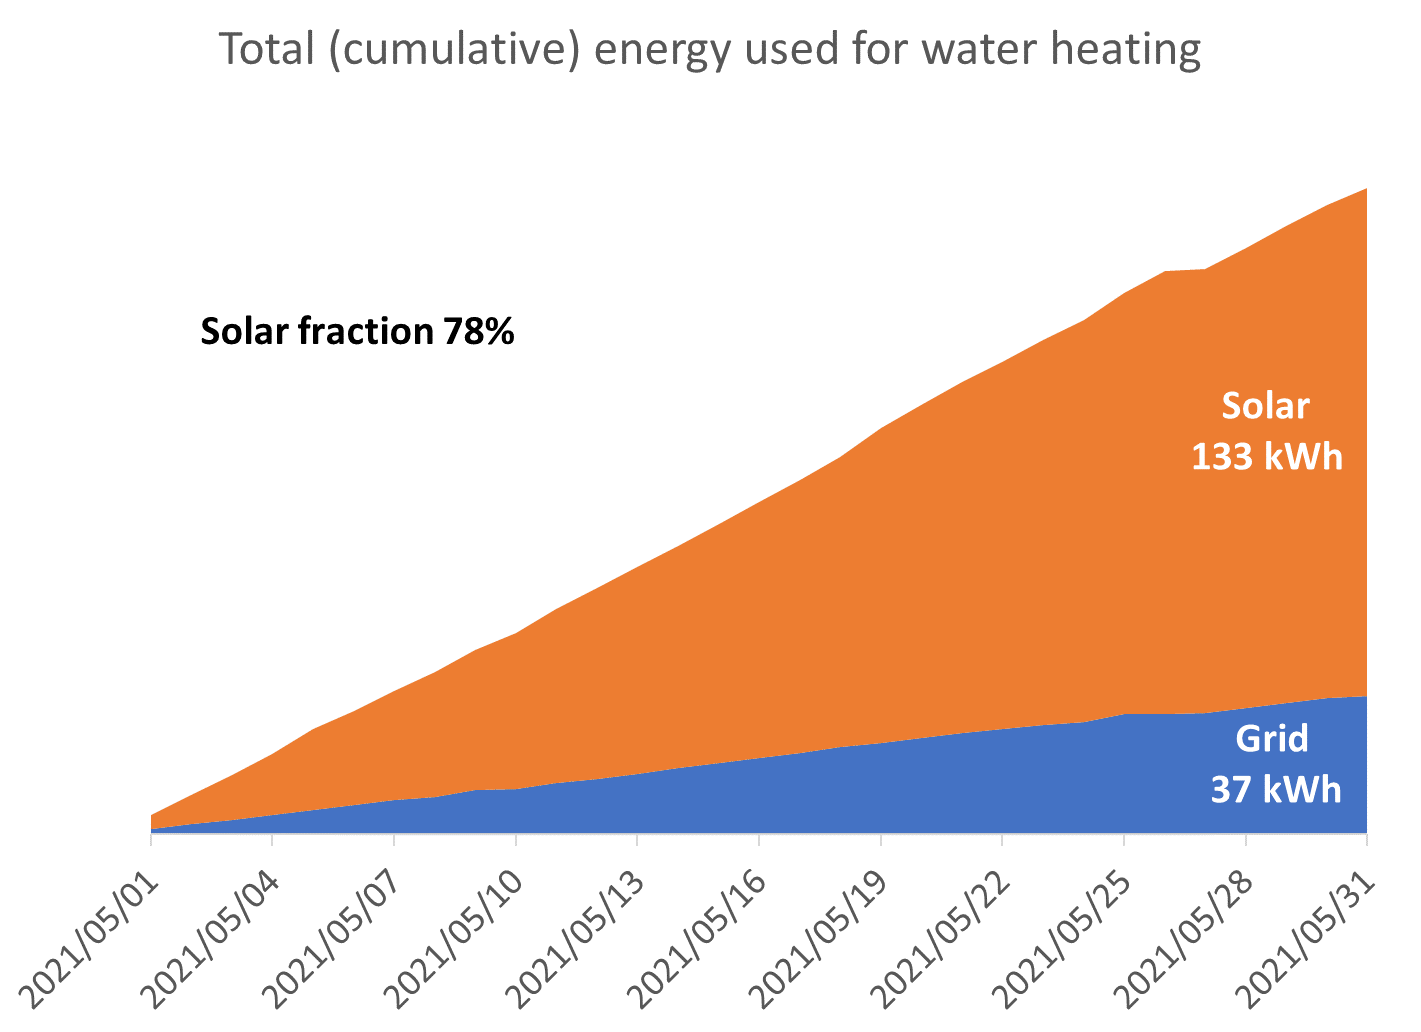
Solar PV array size: 1.5 kWp Family size: 1 person plus domestic worker Solar Fraction achieved: 78% of energy from the sun
When & Where: Johannesburg, May 2021 (Winter)
Comments: Over 75% of this household’s water heating requirements in winter was supplied by the sun.
 |  |
The size of the solar PV array (in other words, the number of solar PV modules on the roof) will directly impact the performance of the Elon® 100. Additionally, time of year and location will also have a substantial impact on system performance. Click here for a PDF with more information.
As can be seen from the graph below, payback period decreases as number of solar panels increases, and is also different for Johannesburg, Cape Town and Durban [1].
The reason that payback period improves (decreases) as number of solar panels increases, is because there are some fixed costs (such as engineering design & safety components) and some costs that do not scale linearly with array size (such as labour, wiring, mounting kit costs, etc.).
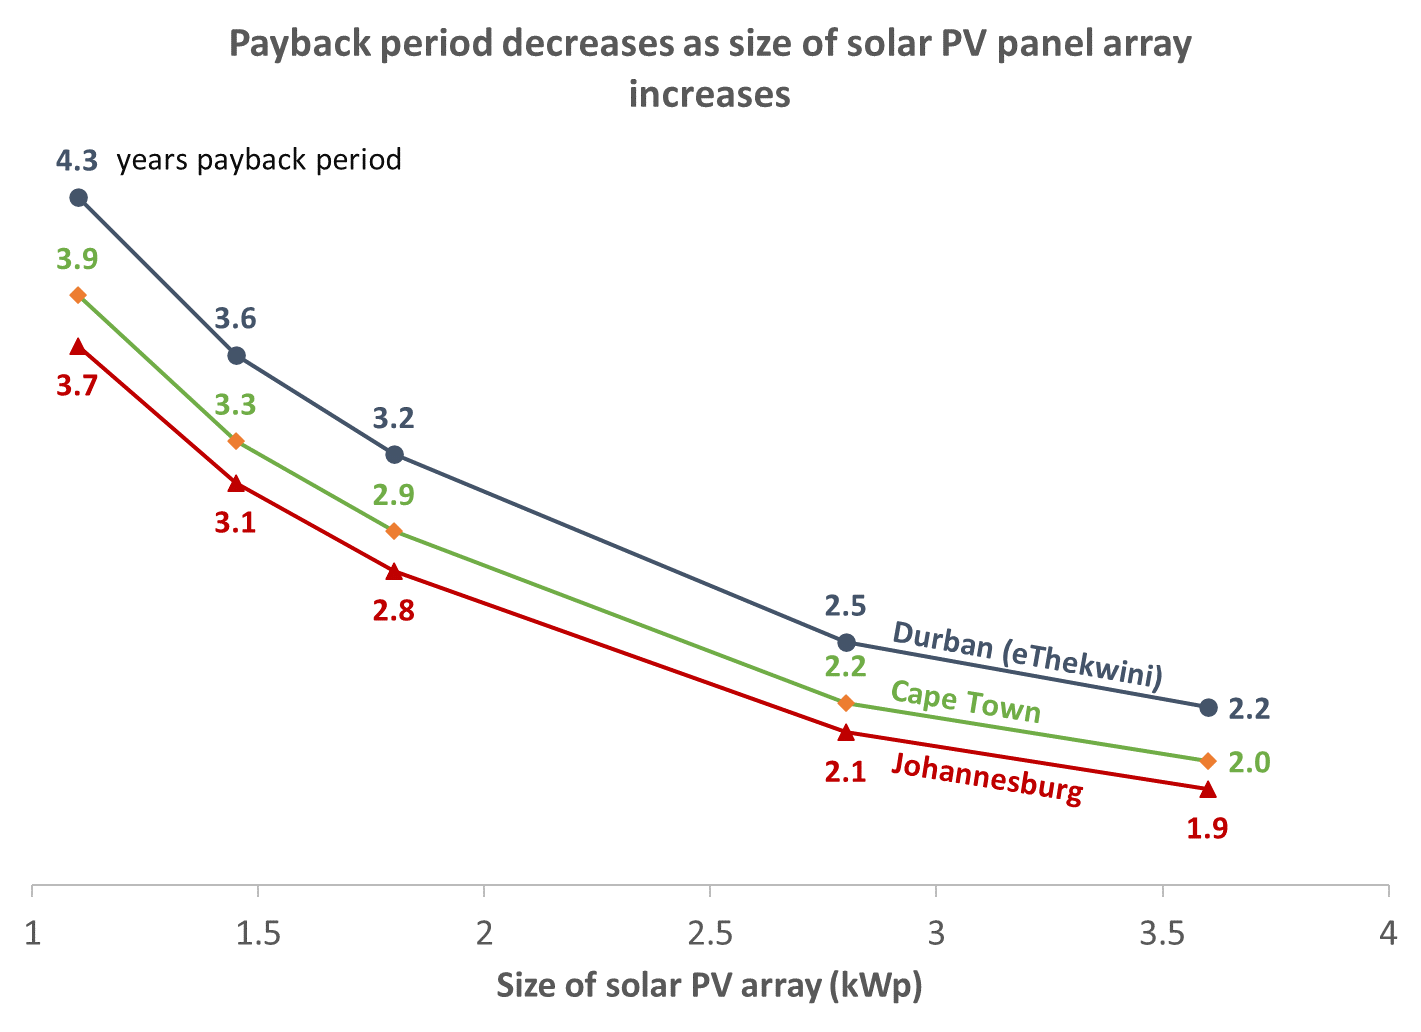
[1] Calculations based on actual Elon® performance, assuming a 20% reduction due to non-optimal user behaviour, an initial electricity tariff of R2.73/kWh (which is the 2021/2022 average residential tariff across the 4 major metropolitan areas Johannesburg, Cape Town, Tshwane and eThekwini) and an annual electricity price increase of 8%.
1. Background
The National Building Regulations in South Africa prescribe compliance with the SANS 10400-XA “Energy Usage in Buildings” Regulations. Part XA2 of these Regulations require all new residential and commercial buildings in South Africa to derive at least 50% of the energy they require for water heating from non-grid energy sources. These alternative sources include heat pumps, biogas, solar thermal and solar photovoltaic (or solar PV).
The question then arises: how does the cost of all these alternative water heating energy sources compare with that of grid electricity bought from a municipality in South Africa?
To compare energy sources with different initial (capital) cost, different lifespans and different operating & maintenance cost, a common approach used is the so-called Levelized Cost of Energy or LCOE. This approach considers all these different costs as well as the total lifespans to produce a single cost per unit of energy (kWh). This then enables direct comparison of different technologies and energy sources.
The PowerOptimal team has calculated the LCOE for several alternative energy sources and presents a summary of the results in this short document. See Appendix A for the basic methodology and inputs used.
2. Results
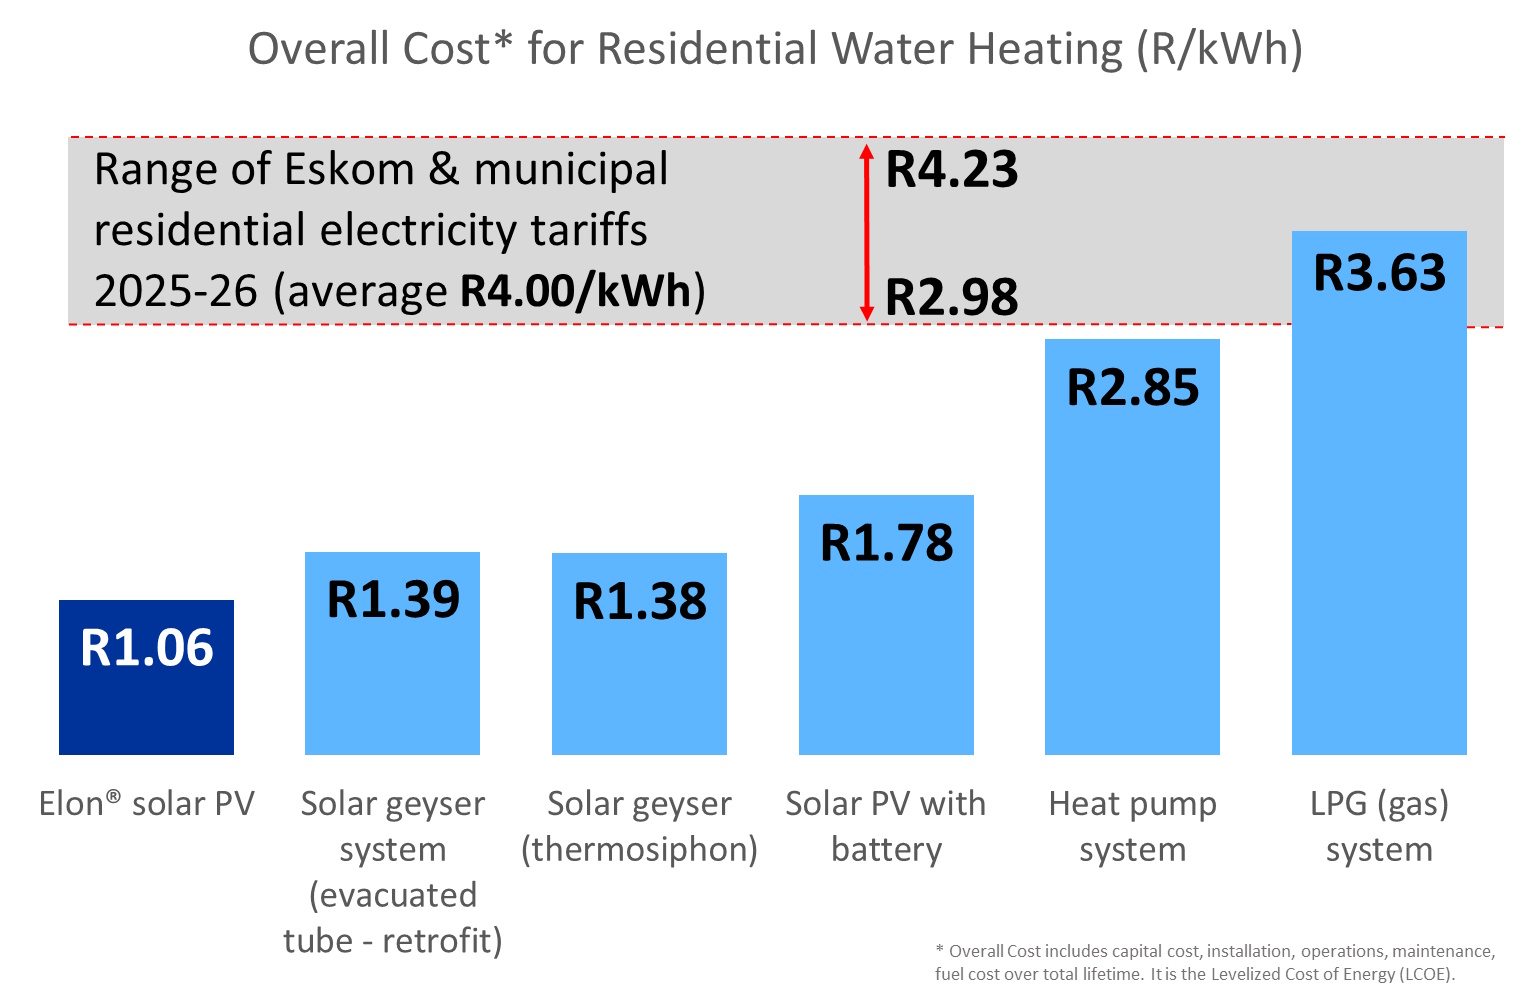
The following observations can be made from the above graph:
- On a levelized cost of energy basis, the Elon® is the lowest cost per unit of energy of any of the options.
- The highest cost option is buying electricity from the municipality and gas geysers.
- Heat pumps continue to incur electricity cost and thus the heat pump energy cost will increase annually.
- LPG prices fluctuate depending on oil prices. Gas only makes sense in case of very low or sporadic hot water use (for example a holiday home).
- Eskom & municipal tariffs increase every year, whilst the effective lifetime cost per kWh for solar PV and solar thermal will remain at these calculated values for their respective lifetimes. It would be possible to finance such a system from a home loan or through solar financing and save more on electricity cost than the installment (in other words realise a net savings whilst incurring no capital cost).
- In 2025/2026 the average marginal electricity tariff for lower to middle income households for the four largest metropolitan municipalities in South Africa (Cape Town, Tshwane, Johannesburg and eThekwini) is R3.92/kWh and for middle-upper income it is R4.03/kWh. This will increase again in July 2026.
Appendix A. Methodology and inputs
The LCOE can be calculated as [1]:

Here are the input values with sources as used in the calculations:
| Description | Value | Units | Source |
| Elon® annual solar PV energy production in Johannesburg | 1622 | kWh/kWp/year | Based on actual measurements |
| Average Elon® energy utilization | 90% | Conservative assumption for comparison | |
| Elon® fully installed cost for a 1.41 kWp system | R21 500 | Incl. VAT | Typical actual cost |
| Annual real electricity price increase | 8% | Estimate | |
| Average electricity price (4 largest metros) 2025–2026 | R4.00 | per kWh | Calculated from municipal tariffs |
| Real weighted average cost of capital | 8% | per year | Yelland (2016) |
| Annual maintenance cost – Elon® | R100 | per year | Cleaning allowance |
| Solar PV panel degradation | 0.5% | per year | EnergySage |
| Solar irradiance – Johannesburg | 5.46 | kWh/m²/day | Solar Electricity Handbook |
| Solar thermal system energy production | 6.245 | kWh/day | SESSA |
| Thermosiphon solar thermal system fully installed cost | R19 783 | incl. VAT | Sustainable.co.za and solar.co.za Aug 2025 |
| Evacuated tube solar thermal system retrofit fully installed cost | R20 005 | incl. VAT | Sustainable.co.za and solar.co.za Aug 2025 |
| Solar thermal maintenance cost | R500 | per year | Estimate |
| Heat pump system lifetime | 15 | years | Industry sources |
| Heat pump system fully installed cost | R20 298 | incl. VAT | rightair.co.za for 3.6 kW ITS system Aug 2025 |
| Heat pump system COP (coefficient of performance) | 3 | See references [2] and [3] | |
| Heat pump system annual maintenance | R1000 | per year | [4] |
| Gas geyser installed cost | R9 499 | Incl. VAT | Makro & National Gas Installers |
| Gas geyser annual maintenance cost | R500 | per year | Estimate |
| Gas geyser lifetime | 10 | years | Typically from 8 – 12 years. |
| Gas (LPG) price (Gauteng) | R36.60 | per kg | Average for 2025. Fuels Industry Association of South Africa |
| Solar PV + battery residential LCOE | R1.78 | per kWh | Calculated (Aug-2025) |
[1] Yelland C. 2016. Understanding the cost of electricity from Medupi, Kusile and IPPs. Website: https://www.news24.com/fin24/Economy/Eskom/understanding-the-cost-of-electricity-from-medupi-kusile-and-ipps-20160721. Last accessed: 2020/06/24.
[2] Zhang M. 2013. Performance of heat pumps in South Africa. Website: https://www.ee.co.za/wp-content/uploads/legacy/Energize_2013/09_at_01_performance-of-heat.pdf. Last accessed: 2020/06/24.
[3] Tangwe S et al. 2015. Performance optimization of an air source heat pump water heater using mathematical modelling. Journal of Energy in Southern Africa 26(4): 86-95. Website: https://journals.assaf.org.za/index.php/jesa/article/view/2225/2006. Last accessed: 2020/08/05.
[4] Many manufacturers require once-annual inspection & service to maintain their warranties. R500 – R1500/yr. See for example https://heatpumpsportelizabeth.co.za/what-is-the-average-cost-to-install-a-heat-pump/
[5] https://www.oliverheatcool.com/about/blog/news-for-homeowners/the-average-lifespan-of-water-heaters/. Last accessed: 2024/01/20.