Recently we learnt that Eskom has requested another 9.58% tariff increase from NERSA for 2015, on top of the 12.69% already approved for this year. More recently, it has emerged that Eskom is requesting what is called a “selective reopener” for 2016 and 2017 as well. In particular, it seems that Eskom is looking for an additional 9% increase in each of 2016 and 2017 – i.e. 17% increases in tariffs in both these years instead of 8%/year.
People know the power of compound interest (exponential growth!), and so it is interesting to have a look at where Eskom’s (effectively South Africa’s) electricity tariffs have come from and where they seem to be going.
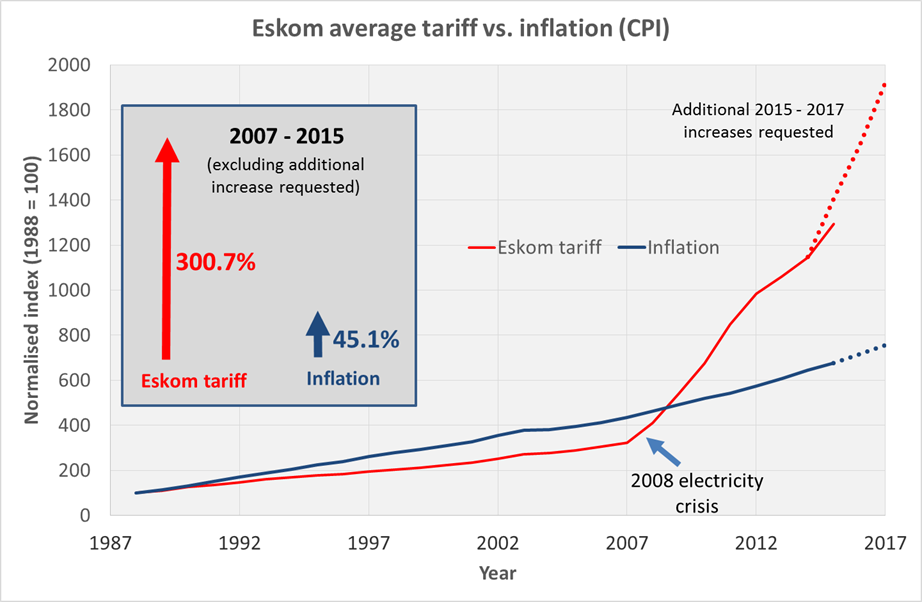
The infographic below shows the Eskom tariffs from 1988 to 2015, plotted against CPI (Consumer Price Index) or inflation over the same period. It also shows projections up to 2017, based on the additional increases requested by Eskom, and based on SARB’s inflation projections.
Note: The infographic depicts overall average increases – actual increases will be different for different types of consumers (residential, commercial and industrial) and will vary between municipalities.
Looking at the graph, the following can be noted:
In the period from 1988 up to the 2008 electricity crisis, electricity tariff increases did not keep tread with inflation. This was partly due to government policy to keep electricity tariffs as low as possible for poor communities, but also due to Eskom having an oversupply of electricity (in the 1990’s) and not investing in new capacity (in the 2000’s).
Between 1988 and 2007, electricity tariffs increased by 223%, whilst inflation over this period was 335%.
From the 2008 electricity crisis onwards, there is a clear and sharp inflection point for electricity tariffs in South Africa. From 2007 to 2015, electricity tariffs increased by 300%, whilst inflation over this period was45%. Thus electricity tariffs tripled in 8 years.
If the additional increase for 2015 (another 9.58% on top of the 12.69% already approved by NERSA) is approved, this will mean that the total increase in electricity tariffs from 2007 to 2015 would be 335%.
If the additional increases for 2016 & 2017 (another 9%/yr on top of the 8%/yr already approved by NERSA) are approved, this will mean that the total increase in electricity tariffs from 2007 to 2017 would be 495%, compared to 74% for inflation over the same period. Thus electricity tariffs would have increased 5-fold in 10 years.
We need to keep in mind that SA’s electricity is still not very expensive when compared to the rest of the world or even Africa. E.g. in 2014, Uganda, Namibia and Ghana had tariffs more than double that of South Africa. However, the problem is that the South African economy has structured itself around cheap electricity, and it will be costly to change the way things are done (behaviour) and change over to more energy-efficient infrastructure.
The SAIRR recently published a report projecting that Eskom will have another 18 000 MW supply shortfall by 2030, if our GDP grows by 3%/yr. This is in addition to Medupi, Kusile and Ingula. (See this Fin24 summary of the report.) To add insult to injury, Standard & Poor’s has just downgraded Eskom to junk status.
Considering the above, it is safe to say that we can expect to see over the next several years: (a) a continuation of the current electricity supply shortages (read: load shedding); and (b) higher-than-inflation electricity price increases. We will all need to start thinking about how we can contribute to reducing demand and minimising the impact of the supply constraints.