ANNEXURE A
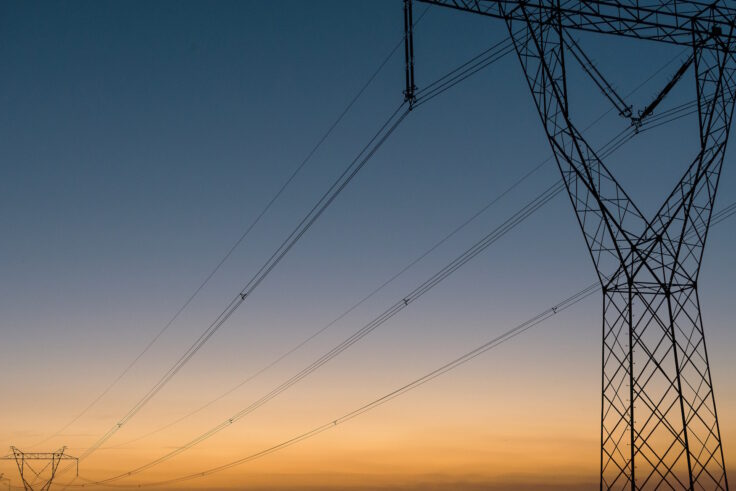
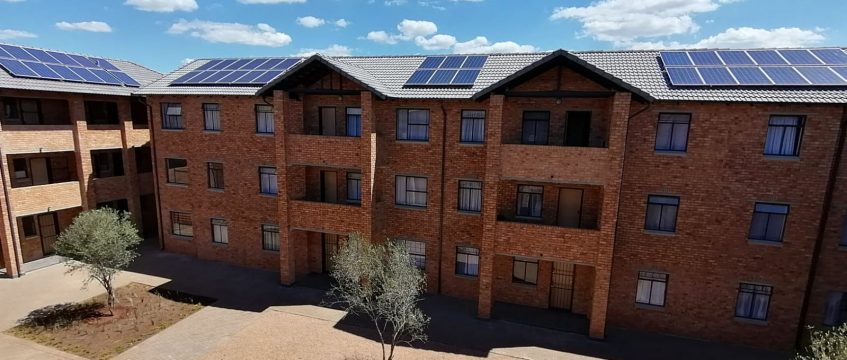
We know that solar PV can offer independence from Eskom’s unreliable service.
Although we were in lock down most of the year, South Africa still experienced its worst year ever of load-shedding in 2020.A total of 1798 GWh shed and 859 hours of outages.
To put that into perspective, there are 8760 hours in a year… We had load-shedding almost 10% of the time in 2020!
Eskom has not been off to a good start in 2021 either. According to data from Eskom se Push we had already seen 560 hours of load-shedding in the first half of 2021.5
Will the situation improve?
According to a technical report by the CSIR, Eskom’s coal fleet’s Energy Availability Factor (EAF) has declined from 94% in 2002 to 57% in 2019. Degrading infrastructure, scheduled maintenance and unexpected breakdowns exacerbate the rate at which the coal fleet’s EAF declines.
This means the situation is likely to get worse (at least, before it gets better).6
Solar PV has also become much more affordable, whereas Eskom is progressively more unaffordable. From 2007 to 2019, Eskom’s average electricity tariffs increased by 446%. Over that same time period, the price of solar PV modules decreased by more than 90% from R57,4/Wp to R5,32/Wp. 7
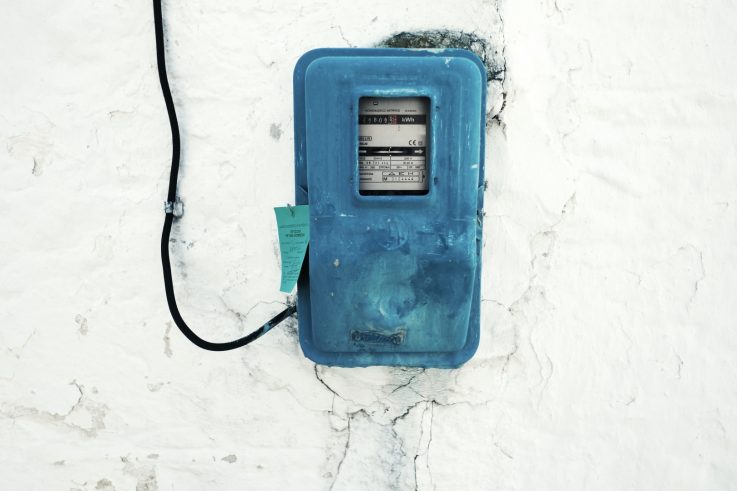
For the 2021/2022 year, the average monthly electricity bill is about R1 508 across all income groups in the four major metropolitan areas (Cape Town, Joburg, City of Tshwane and eThekwini).*B
Solar PV is dramatically more environmentally friendly too.
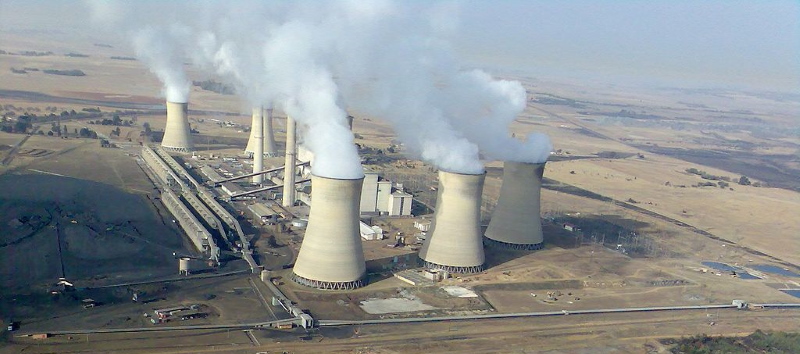
Several lifecycle greenhouse gas (GHG) emissions studies show that solar PV, at only 50g of CO2-eq./kWh, has a fraction of the lifecycle GHG emissions of coal (948g of CO2-eq./kWh). 8
Remember, most of the electricity generated by Eskom comes from coal fired power plants.
These studies analysed the emissions over the entire lifecycle of each technology. From mining of raw materials to manufacturing to operation to decommissioning at the end of its useful life.9
ANNEXURE B
*Monthly electricity and solar PV system cost estimates from Table 1 were adjusted to reflect those in South Africa.
Using the methods from Table 1, we begin our calculation with R2 034, the average monthly electricity bill for lower-middle to upper income groups (LSMs 5 to 10) for the 2021/2022 year.*B
According to the Appraisal Journal, a solar PV system can enable a home sales premium of up to R20 for every R1 saved on annual energy costs.
To calculate potential annual savings, we multiply the R2 034 average monthly electricity bill by 12 months, which equals about R24 000.
Next, we multiply R24 000 by R20 which gives us a potential sales premium of R480 000.
To get to that same R480 000 but using the Lawrence Berkeley National Laboratory method which estimates R75 000 sales premium for every kW of solar installed – you would need to have about a 7kW solar PV system installed. *C and D
According to a 2021 BusinessTech article, having a 5kW solar PV system installed will cost about R110 000.
This equates to R22 000 per kW installed, thus we can expect the 7kW system mentioned above to cost about R150 000.10
If our potential sales premium is about R480 000 and the cost of our solar PV system is about R150 000, we arrive at an arbitrage opportunity of R330 000.
We must consider that, if the potential 4% sales premium is R480 000, the total starting price of our home would need to be R12 000 000.
Since most of us don’t have a home valued at R12 million, let us work out the sales premium using the average selling price of houses in South Africa for property in the lower-middle (R638 200) income group to luxury value property (R2 300 000).11
In 2019, the average selling price of houses for the above groups was about R1 300 000. Subsequently, the 4% sales premium would be about R52 000.
REFERENCES
1 – https://www.corelogic.com/intelligence/the-top-four-ways-millennials-are-changing-the-housing-market/
2 – https://blog.pamgolding.co.za/greener-living-rise/
3 – https://www.ooba.co.za/resources/living-off-the-grid/
4 – https://www.solarreviews.com/blog/do-solar-panels-increase-home-value
5 – https://www.timeslive.co.za/news/south-africa/2021-06-09-dark-times-weve-had-560-hours-of-load-shedding-so-far-in-2021/
6 – https://researchspace.csir.co.za/dspace/bitstream/handle/10204/11483/Wright_2020_edited.pdf?sequence=7&isAllowed=y
7 – https://ourworldindata.org/grapher/solar-pv-prices
8 – https://www.ipcc.ch/site/assets/uploads/2018/02/ipcc_wg3_ar5_chapter7.pdf
9 – https://reinvestproject.eu/wp-content/uploads/2019/11/OR_RE-INVEST_Life-cycle-GHG-emissions-of-renewable-and-non-renewable-electricity.pdf
10 – https://businesstech.co.za/news/energy/313854/this-is-how-much-it-will-cost-to-install-solar-panels-in-south-africa-based-on-the-size-of-your-house/
11 – https://www.intergate-immigration.com/blog/cost-of-living-in-south-africa-ultimate-guide/
Methods and Assumptions
*A – The ranges shown in the “Real Value: An Overview of Estimates” illustration, as well as the more detailed sales premium estimation guideline found in Annexure B, are based on rough international data which we further adjusted to make it more relevant in the South African context.
With many variables, some of which have changed drastically over the last few years, these sales premium ranges and estimation guidelines are rough at best. They are only intended to give a basic idea of how a solar PV system can potentially lead to a home sales premium.
*B – Average residential electricity consumption data was obtained from: Goliger, A. and Cassim, A. (14 and 15 July 2017). Tipping Points: The Impacts of Rising Electricity Tariffs on Households and Household Electricity Demand. 3rd Annual Competition and Economic Regulation (ACER) 2017 Conference, Dar es Salaam, Tanzania. Last accessed: 21/08/2017.
*B – Average effective residential electricity tariffs were calculated from the published 2021/22 tariffs of the following four metropolitan municipalities: City of Johannesburg, City of Tshwane, City of Cape Town and Ethekwini, using the average electricity consumption values for LSM5-10 obtained from the above references.
*C – The solar PV systems as discussed in this article include battery back-up. Thus they are either hybrid or off-grid residential solar PV systems. Grid tied systems do have some form of back-up (AC grid power) and provide cost savings with solar energy. However, they do not have back-up in the case of load-shedding. Thus, in our estimations we focused on hybrid and off-grid solar PV systems.
*D – At the time of writing the exchange rate was R15 to the Dollar
