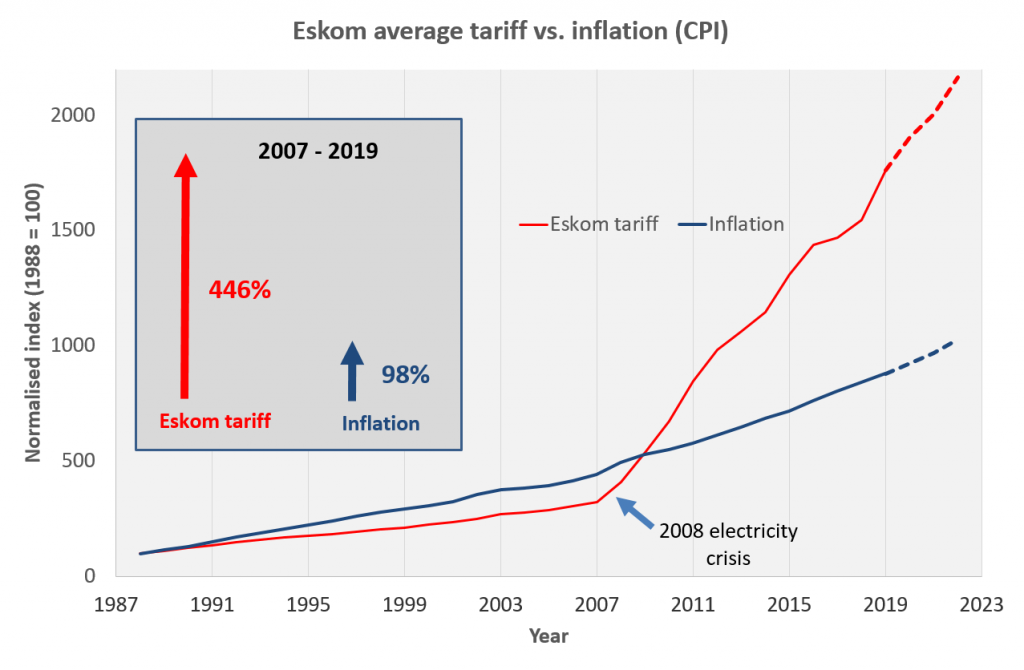
The graph below shows the Eskom tariffs from 1988 to 2019, plotted against CPI (Consumer Price Index) or inflation over the same period. It also shows projections up to 2022, based on currently projected increases as approved by NERSA (8.1% in 2020 and 5.2% in 2021), as well as Stats SA and the Bureau for Economic Research’s inflation projections.
Note: The graph depicts overall average increases – actual increases will be different for different types of consumers (residential, commercial and industrial) and will vary between municipalities.
Looking at the graph, the following can be noted:
In the period from 1988 up to the 2008 electricity crisis, electricity tariff increases did not keep tread with inflation. This was partly due to government policy to keep electricity tariffs as low as possible for poor communities, but also due to Eskom having an oversupply of electricity (in the 1990’s) and not investing in new capacity (in the 2000’s).
Between 1988 and 2007, electricity tariffs increased by 223%, whilst inflation over this period was 335%.
From the 2008 electricity crisis onwards, there is a clear and sharp inflection point for electricity tariffs in South Africa. From 2007 to 2019, electricity tariffs increased by 446%, whilst inflation over this period was98%. Thus electricity tariffs increased more than four-fold in 12 years.
Based on the currently approved increases for 2020 and 2021, the total increase in electricity tariffs from 2007 to 2021 will be 520%. By then, electricity tariffs would have increased more than5-fold in 14 years.
Considering the current serious state of Eskom’s debt and the fact that the country probably cannot afford for Eskom to fail, consumers can likely expect a continuance of much higher than inflation electricity price increases over the next several years. Eskom is in serious need of restructuring, but this is likely to face strong resistance from the trade unions.
One thought on “2019 update: Eskom tariff increases vs inflation since 1988 (with projections to 2022)”