In 2021, we published an analysis of municipal water & electricity tariff increases compared to inflation since 1996.
That analysis revealed a shocking reality: the average price of both water & electricity across the four largest South African municipalities increased about four times faster than inflation.
This was a sad state of affairs in a country where a large part of the population lives in poverty.
We updated the analysis in 2024, when it emerged that the trend of higher-than-inflation water & electricity tariffs had unfortunately continued, with the average price of water & electricity increasing five times faster than inflation since 1996.
The question is: have things improved or deteriorated further since 2024?
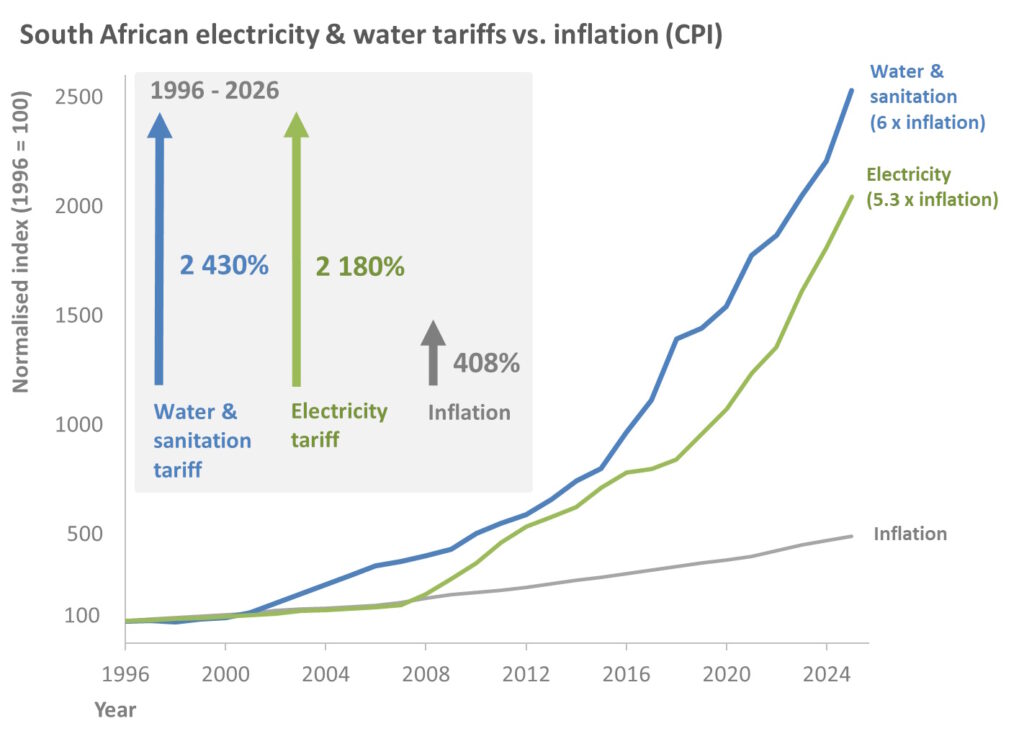
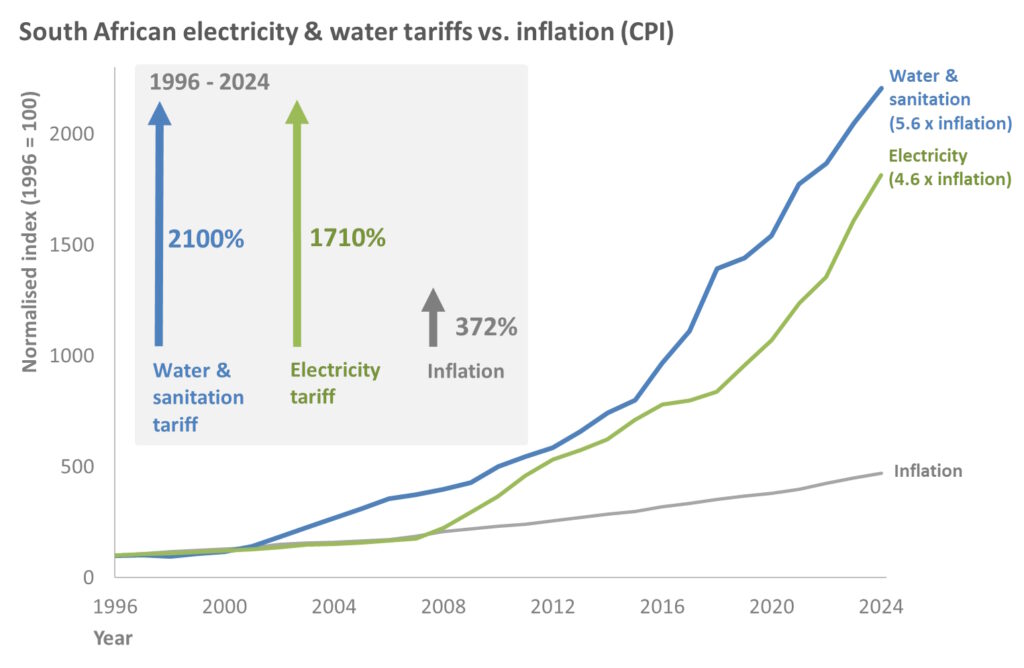
To answer this question, we have updated the analysis with data up to 2026. The result is shown in the graph below.
Note: The graph depicts overall average increases for residential consumers – actual increases will be different for different types of consumers (residential, commercial and industrial) and will vary between municipalities.
Looking at the graph, the following can be noted:
Both water and electricity tariffs have increased dramatically faster than inflation over the period 1996 to 2026.
In fact, water tariffs have increased even faster than electricity tariffs, despite the electricity tariff increases receiving a lot more negative attention from the press and consumers.
Over the period 1996 to 2026, electricity tariffs increased 5.3 times faster than inflation and water tariffs increased 6 times faster than inflation.
The unfortunate conclusion is that the unsustainable trend of much higher than inflation increases in the price of water & electricity by municipalities has continued over the past two years.
In 2015, 2017, 2019, 2022 and 2024 we published infographics showing Eskom annual tariff increases since 1988 compared to inflation.
Eskom tariffs again increased by substantially more than inflation in 2025, with an average increase of 12.74%. This compares to a CPI (Consumer Price Index) increase of 3.79% over the same year.
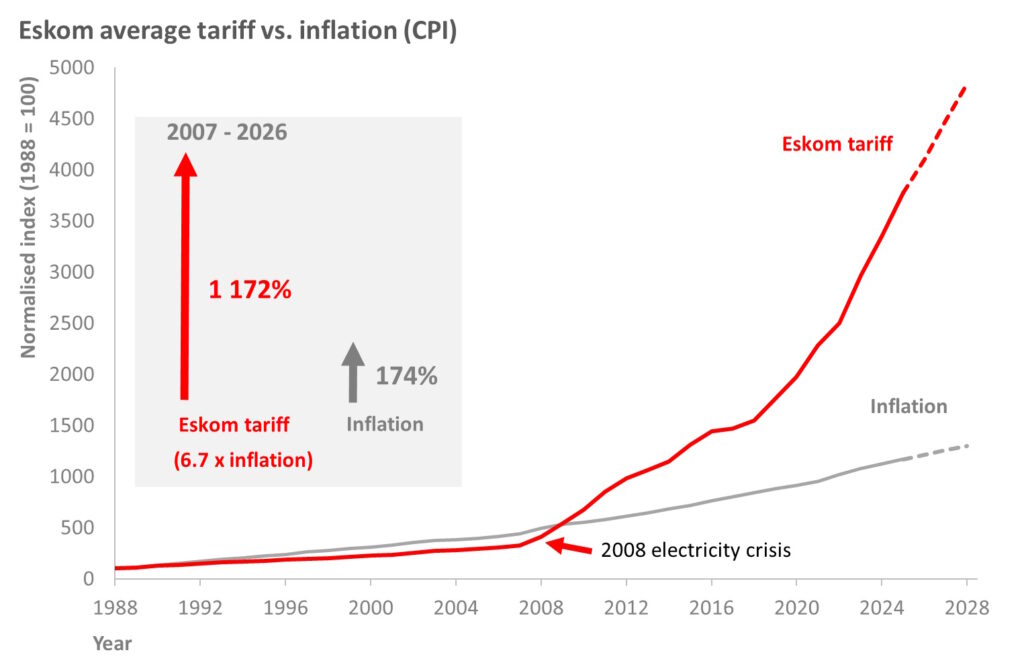
The graph below shows the Eskom tariffs from 1988 to 2026, plotted against CPI (Consumer Price Index) or inflation over the same period. It also shows projections up to 2028, based on inflation projections and Eskom’s already approved increases of 8.76% in 2026 and 9.19% in 2027.
Note: The graph depicts overall average increases – actual increases will be different for different types of consumers (residential, commercial and industrial) and will vary between municipalities.
Looking at the graph, the following can be noted:
In the period from 1988 up to the 2008 electricity crisis, electricity tariff increases did not keep tread with inflation. This was partly due to government policy to keep electricity tariffs as low as possible for poor communities, but also due to Eskom having an oversupply of electricity (in the 1990’s) and not investing in new capacity (in the 2000’s).
Between 1988 and 2007, electricity tariffs increased by 223%, whilst inflation over this period was 335%.
From the 2008 electricity crisis onwards, there is a clear and sharp inflection point for electricity tariffs in South Africa. From 2007 to 2026, electricity tariffs increased by 1 172%, whilst inflation over this period was174%. Thus, electricity tariffs increased more than six-fold (or SIX times faster than inflation) in real money terms in 18 years.
Based on the already-approved increases of 8.76% in 2026 and 9.19% in 2027, these above-inflation increases are unfortunately set to continue.
In 2021, we published an analysis of municipal water & electricity tariff increases compared to inflation since 1996.
That analysis revealed a shocking reality: the average price of both water & electricity across the four largest South African municipalities increased about four times faster than inflation.
This was a sad state of affairs in a country where a large part of the population lives in poverty.
The question is: have things improved or deteriorated further since 2021?
To answer this question, we have updated the analysis with data up to 2024. The result is shown in the graph below.
Note: The graph depicts overall average increases for residential consumers – actual increases will be different for different types of consumers (residential, commercial and industrial) and will vary between municipalities.
Looking at the graph, the following can be noted:
Both water and electricity tariffs have increased dramatically faster than inflation over the period 1996 to 2024.
In fact, water tariffs have increased even faster than electricity tariffs, despite the electricity tariff increases receiving a lot more negative attention from the press and consumers.
Over the period 1996 to 2024, electricity tariffs increased almost 5 times faster than inflation and water tariffs increased almost 6 times faster than inflation.
The unfortunate conclusion is that the unsustainable trend of much higher than inflation increases in the price of water & electricity by municipalities has continued over the past three years.
In 2015, 2017, 2019 and 2022 we published infographics showing Eskom annual tariff increases since 1988 compared to inflation.
Eskom tariffs increased by an eye-watering 18.7% in 2023 and again by a painful 12.7% in 2024. This compares to CPI (Consumer Price Index) increases of 5.9% and 4.9% over the same two-year period.
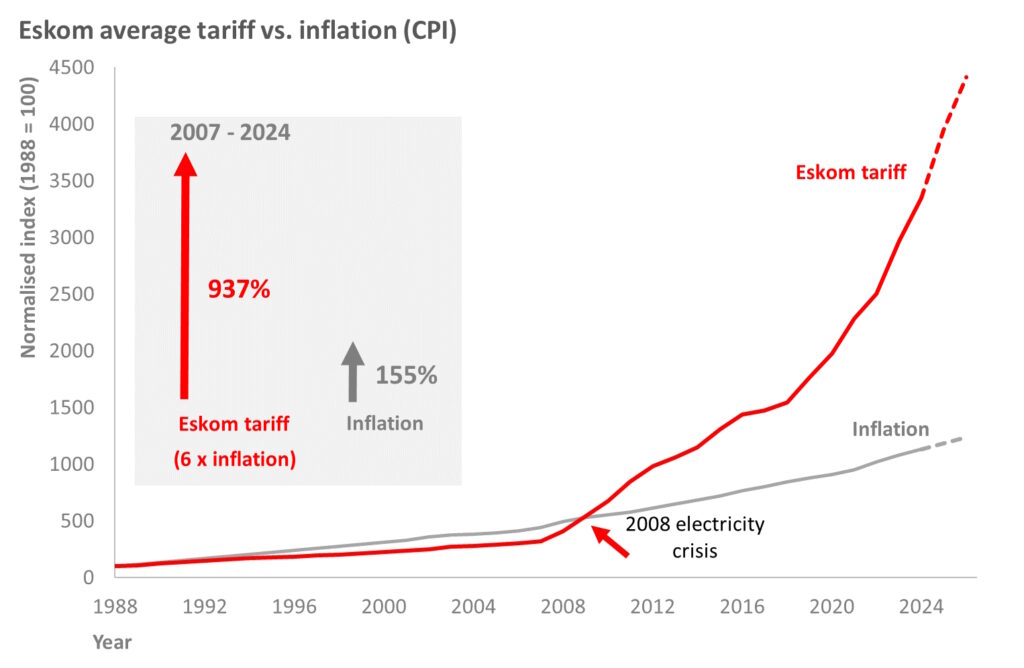
The graph below shows the Eskom tariffs from 1988 to 2024, plotted against CPI (Consumer Price Index) or inflation over the same period. It also shows projections up to 2026, based on inflation projections and Eskom’s planned applications to NERSA (and assuming NERSA only grants half their requested increase of 36.15% for 2025).
Note: The graph depicts overall average increases – actual increases will be different for different types of consumers (residential, commercial and industrial) and will vary between municipalities.
Looking at the graph, the following can be noted:
In the period from 1988 up to the 2008 electricity crisis, electricity tariff increases did not keep tread with inflation. This was partly due to government policy to keep electricity tariffs as low as possible for poor communities, but also due to Eskom having an oversupply of electricity (in the 1990’s) and not investing in new capacity (in the 2000’s).
Between 1988 and 2007, electricity tariffs increased by 223%, whilst inflation over this period was 335%.
From the 2008 electricity crisis onwards, there is a clear and sharp inflection point for electricity tariffs in South Africa. From 2007 to 2024, electricity tariffs increased by 937%, whilst inflation over this period was155%. Thus, electricity tariffs increased six-fold (or SIX times faster than inflation) in real money terms in 16 years.
Eskom plans to apply for another 36.15% increase in 2025, so unfortunately it seems the dramatic increases in electricity prices are likely to continue.
In 2015, 2017 and 2019 we published infographics showing Eskom annual tariff increases since 1988 compared to inflation.
Following Eskom’s court order success against NERSA in early 2021, it increased electricity prices by an average of 15.63% in April 2021. In April 2022, a further increase of 9.61% was approved. So what do the numbers look like today?
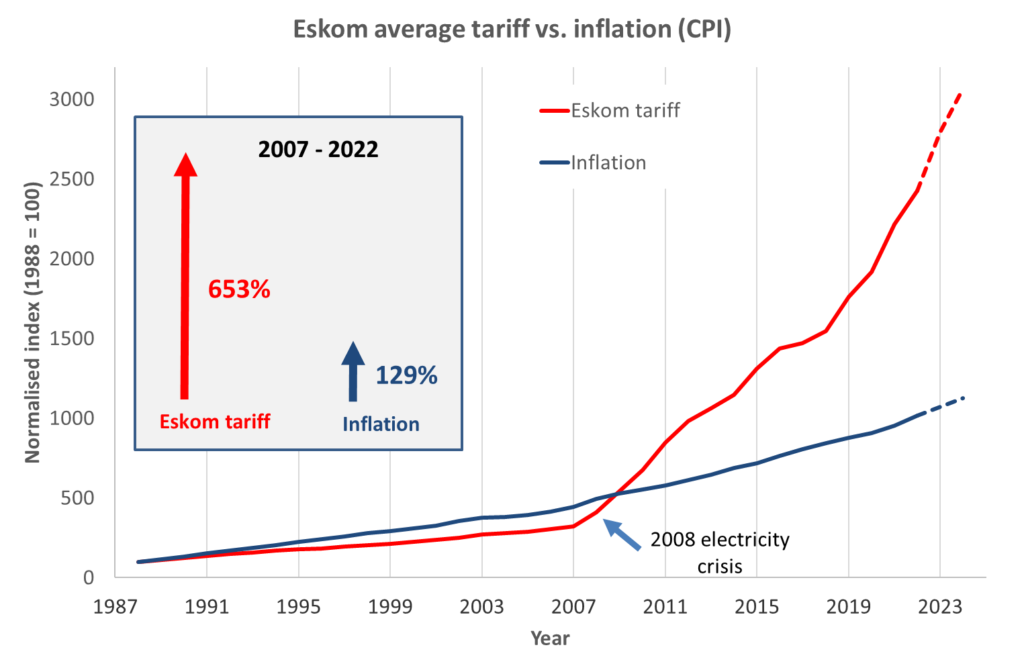
The graph below shows the Eskom tariffs from 1988 to 2022, plotted against CPI (Consumer Price Index) or inflation over the same period. It also shows projections up to 2024, based on expert forecasts and inflation projections.
Note: The graph depicts overall average increases – actual increases will be different for different types of consumers (residential, commercial and industrial) and will vary between municipalities.
Looking at the graph, the following can be noted:
In the period from 1988 up to the 2008 electricity crisis, electricity tariff increases did not keep tread with inflation. This was partly due to government policy to keep electricity tariffs as low as possible for poor communities, but also due to Eskom having an oversupply of electricity (in the 1990’s) and not investing in new capacity (in the 2000’s).
Between 1988 and 2007, electricity tariffs increased by 223%, whilst inflation over this period was 335%.
From the 2008 electricity crisis onwards, there is a clear and sharp inflection point for electricity tariffs in South Africa. From 2007 to 2022, electricity tariffs increased by 653%, whilst inflation over this period was129%. Thus, electricity tariffs increased four-fold (or quadrupled) in real money terms in 14 years.
Considering the current serious state of Eskom’s debt and the fact that the country probably cannot afford for Eskom to fail, consumers can likely expect a continuance of much higher than inflation electricity price increases over the next several years.
In fact, Eskom has already applied to NERSA for a 32% tariff increase in April 2023. It has also applied to NERSA to restructure residential tariffs to ‘reflect cost drivers more accurately’. The restructured tariffs will see two main options for direct Eskom customers – Homepower and Homeflex.
For the Homepower tariff, the grid connection fee would increase from R218/month to R938/month – this is the charge before you have used a single kWh of electricity!
The Homeflex tariff will introduce time-of-use charges – in other words, the price of electricity will change depending on the time of day. (Time-of-use charges is widespread internationally, and helps to balance grid load by incentivising electricity use outside of peak hours.)
Eskom is in serious need of restructuring – which the government at last acknowledged and announced in 2019. As of October 2022 this restructuring has not yet been completed, but is in progress.
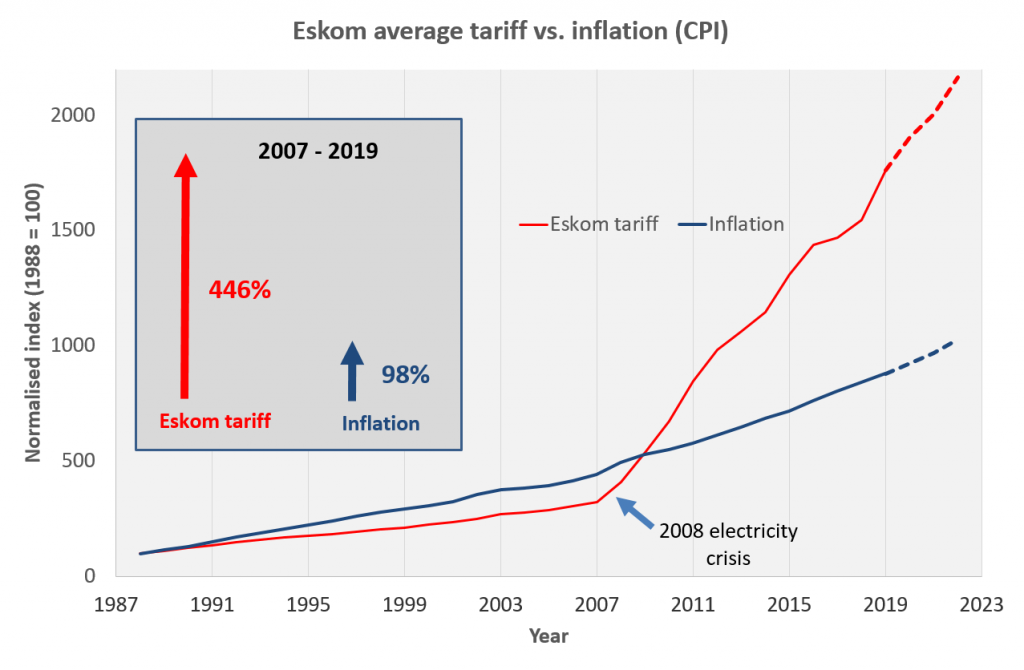
The graph below shows the Eskom tariffs from 1988 to 2019, plotted against CPI (Consumer Price Index) or inflation over the same period. It also shows projections up to 2022, based on currently projected increases as approved by NERSA (8.1% in 2020 and 5.2% in 2021), as well as Stats SA and the Bureau for Economic Research’s inflation projections.
Note: The graph depicts overall average increases – actual increases will be different for different types of consumers (residential, commercial and industrial) and will vary between municipalities.
Looking at the graph, the following can be noted:
In the period from 1988 up to the 2008 electricity crisis, electricity tariff increases did not keep tread with inflation. This was partly due to government policy to keep electricity tariffs as low as possible for poor communities, but also due to Eskom having an oversupply of electricity (in the 1990’s) and not investing in new capacity (in the 2000’s).
Between 1988 and 2007, electricity tariffs increased by 223%, whilst inflation over this period was 335%.
From the 2008 electricity crisis onwards, there is a clear and sharp inflection point for electricity tariffs in South Africa. From 2007 to 2019, electricity tariffs increased by 446%, whilst inflation over this period was98%. Thus electricity tariffs increased more than four-fold in 12 years.
Based on the currently approved increases for 2020 and 2021, the total increase in electricity tariffs from 2007 to 2021 will be 520%. By then, electricity tariffs would have increased more than5-fold in 14 years.
Considering the current serious state of Eskom’s debt and the fact that the country probably cannot afford for Eskom to fail, consumers can likely expect a continuance of much higher than inflation electricity price increases over the next several years. Eskom is in serious need of restructuring, but this is likely to face strong resistance from the trade unions.

