In 2015, 2017 and 2019 we published infographics showing Eskom annual tariff increases since 1988 compared to inflation.
Following Eskom’s court order success against NERSA in early 2021, it increased electricity prices by an average of 15.63% in April 2021. In April 2022, a further increase of 9.61% was approved. So what do the numbers look like today?
The graph below shows the Eskom tariffs from 1988 to 2022, plotted against CPI (Consumer Price Index) or inflation over the same period. It also shows projections up to 2024, based on expert forecasts and inflation projections.
Note: The graph depicts overall average increases – actual increases will be different for different types of consumers (residential, commercial and industrial) and will vary between municipalities.
Looking at the graph, the following can be noted:
In the period from 1988 up to the 2008 electricity crisis, electricity tariff increases did not keep tread with inflation. This was partly due to government policy to keep electricity tariffs as low as possible for poor communities, but also due to Eskom having an oversupply of electricity (in the 1990’s) and not investing in new capacity (in the 2000’s).
Between 1988 and 2007, electricity tariffs increased by 223%, whilst inflation over this period was 335%.
From the 2008 electricity crisis onwards, there is a clear and sharp inflection point for electricity tariffs in South Africa. From 2007 to 2022, electricity tariffs increased by 653%, whilst inflation over this period was129%. Thus, electricity tariffs increased four-fold (or quadrupled) in real money terms in 14 years.
Considering the current serious state of Eskom’s debt and the fact that the country probably cannot afford for Eskom to fail, consumers can likely expect a continuance of much higher than inflation electricity price increases over the next several years.
In fact, Eskom has already applied to NERSA for a 32% tariff increase in April 2023. It has also applied to NERSA to restructure residential tariffs to ‘reflect cost drivers more accurately’. The restructured tariffs will see two main options for direct Eskom customers – Homepower and Homeflex.
For the Homepower tariff, the grid connection fee would increase from R218/month to R938/month – this is the charge before you have used a single kWh of electricity!
The Homeflex tariff will introduce time-of-use charges – in other words, the price of electricity will change depending on the time of day. (Time-of-use charges is widespread internationally, and helps to balance grid load by incentivising electricity use outside of peak hours.)
Eskom is in serious need of restructuring – which the government at last acknowledged and announced in 2019. As of October 2022 this restructuring has not yet been completed, but is in progress.
This article seeks to examine the price and affordability of water and electricity in South Africa. We embark on a tough but important journey to shed light on how the price of electricity and water has changed over the last 25 years, and how these basic needs have become less affordable for us, the citizens of South Africa.
On this journey, we discuss the following topics in 5 short chapters (click the link to go directly to a specific chapter):
The increase in Eskom’s average electricity tariff vs. inflation (CPI) – click here to read
The increase in the average municipal water and sanitation tariff for three different income levels vs. inflation (CPI) – click here to read
The contrast between the increases in South African electricity and water tariffs vs. inflation (CPI) – click here to read
How South Africans’ monthly electricity and water bills have changed in the past 25 years in both nominal and current money – click here to read
The combined electricity and water bill of an average South African household vs. average household disposable income in South Africa – click here to read
Each of the above topics is accompanied by a graph to aid the discussion and illustrate the seriousness of the situation in South Africa.
We hope to highlight the pertinence of wise water usage and efficient energy consumption and to stimulate the conversation surrounding what we could and should do to ensure sustainable and affordable access to these basic needs for all South African citizens.
For methods, assumptions and references, click here.
Chapter 1. Eskom average tariff vs. inflation (CPI)
The state of South Africa’s electricity provider, Eskom, is no secret. Plagued by ageing infrastructure, mismanagement, corruption, shrinking or stagnant revenues and increasing debt, the state-owned utility is caught in what is known as a ‘death spiral’.
The impact of these issues manifests in two ways. The first is known as load-shedding, something with which we as South Africans have become all too familiar. The second is the infamous Eskom electricity tariff increases. Ideally these tariff increases would be somewhat in line with increases in inflation… Oh what a perfect world that would be!
In sunny South Africa, electricity tariffs have increased by 512% from 2007 to 2020 (see the graph). That is 5 times faster than inflation! Eishkom?
To top it all off, Eskom was recently granted a R13 billion clawback by NERSA, as well as an additional R69 billion clawback, resulting from a court judgement in Eskom’s favour[a].
What does that mean for us? We, the citizens of South Africa, are set to experience further rapid electricity bill escalations over the next few years. It goes without saying that those increases will not be accompanied by improved service delivery.
Speaking of rapid escalations, has anyone kept an eye on their water bill? In the next chapter we take a closer look at municipal water tariffs.
Chapter 2. Average municipal water & sanitation tariff vs. inflation (CPI)
In the previous chapter we discussed the 512% increase in the average Eskom electricity tariff since 2007. We shall now embark on the 2nd leg of our journey in which we highlight an equally odious development in a tariff that has received a lot less negative press: Water and sanitation.
You are not alone if you allowed the increasing cost of your most basic need to go unnoticed…
Perhaps now is the time to explore the real water tariff trends, overshadowed by Eskom’s conspicuous plight and camouflaged by a complicated tariff structure, but which impacts our daily lives as South African citizens. Think back to ‘Day Zero’ in 2018 and the questions surrounding a lack of access to water and water insecurity in South Africa.
Now ask yourself this: Is it possible that the cost of the water provided by municipalities has increased faster than inflation, considering the deteriorating service delivery on a broader scale?
As can be seen in the graph, average municipal water tariffs have increased four times faster than inflation since 1996.
Essentially, the average municipal water tariff was almost 1300% higher in 2020 than in 1996… Unfortunately, we must bear this burden together with that of Eskom’s runaway tariffs.
In the next chapter, we compare electricity and water & sanitation tariffs over the past 25 years and consider why the increases in average municipal water tariffs have gone largely unnoticed.
Chapter 3. South African electricity and water tariffs vs. inflation (CPI)
In the previous chapter, we highlighted the dizzying increases in average municipal water tariffs since 1996. The numbers are startling to say the least, which begs us to ask: how could such exorbitant increases happen right under our noses without a public outcry?
The bulk of negative public attention and sentiment has been aimed at Eskom… Rightfully so, however, it may have distracted us from an equally pressing issue.
Water tariffs (1270%) have increased even faster than electricity tariffs (1120%) over the past 25 years (1996 to 2020).
But we have an excuse for our ignorance, for these staggering municipal water tariff increases are cloaked by more than Eskom’s shadow.
To begin with, our water tariffs appear as only one component in a larger municipal bill and are thus hidden in the details. Furthermore, every municipality sets its own water tariffs and structures them in a more complicated way than residential electricity tariffs. This tariff structure is known as block tariffs, where the price per unit of water increases in blocks as usage increases.
Consequently, it is more difficult for people to make direct comparisons and to know the real cost of each unit of water.
Our journey to unearth the truth would be incomplete without investigating the real monetary impact of these increases. How has the price of water and electricity changed over the past 25 years in current money terms? In the next chapter, we illustrate and discuss how these increases have affected our monthly electricity and water bills in both nominal and current money.
Chapter 4. South African monthly electricity and water bills 1996 to 2021 (nominal and current money)
Electricity and water tariff trends in South Africa were explored in the previous articles in this series. But this would be rather meaningless without highlighting how this translates into the monthly electricity and water bills of the average South African.
What was the monthly water and electricity bill 25 years ago compared to what we are paying today?
Not accounting for inflation, the average monthly electricity and water bill for lower to middle income families was a mere total of R161 in 1996. Fast forward to 2020 and this average monthly electricity and water bill has ballooned to R2 028!
The question you should now be asking is: “how much of that increase was due to inflation”?
As I am sure you would have guessed, the answer is not much. The next graph tells the story.
Essentially, this graph tells us that in 1996 the average electricity and water bill was R638 in today’s money. A stark contrast to the R2 028 average monthly electricity and water bill in 2020.
These prices have been adjusted for inflation and so the increases seen in the above graph are entirely the result of above-inflation tariff increases implemented by Eskom and local municipalities.
An over-arching question remains: Can we afford these exponential increases in the cost of two of our most basic needs?
We will answer this important question in the final leg of our journey, in which we compare the average electricity and water bills to the average household disposable income in South Africa over the past 25 years.
Chapter 5. Electricity & water bill vs average household disposable income in South Africa
The final leg of our journey is arguably the most pertinent. We know for certain that inflation is not the major cause of the increases in electricity and water tariffs. But the real question is: Can we afford these spiralling electricity and water bills? Did South Africans’ average income keep pace?
Looking at the above graph, the conclusion must be a deafening no. While our average monthly electricity and water bills have increased by 200% since 1996, our average household disposable income[b] has increased by a mere 37% since 1996.
The divergence between these basic costs and household income is especially pronounced from 2008 onward (the past 12 years). Furthermore, our disposable income has been impacted by economic downturns and, more recently, rising income tax rates.
Two of our basic needs have become increasingly unaffordable and we continue to struggle with load-shedding. Now more than ever, we need to take practical steps to explore alternative solutions.
Although the current outlook is bleak, there is hope on the horizon. In October 2020, the Department of Mineral Resources and Energy gazetted amendments to the electricity regulations, allowing municipalities to generate and procure their own electricity. South Africa has some of the best solar PV and wind resources in the world and the cost of these options continues to fall, making self-generation as well as the renewable aspirations of the Integrated Resource Plan (IRP) more viable every day.
Appendix A. Methods & assumptions
Average electricity consumption data for different LSM (Living Standards Measure) categories was obtained from Reference [1]. LSM 1 to 4 were classified as low income, LSM 5-6 were classified as lower to middle income and LSM 7-10 were classified as middle to upper income.
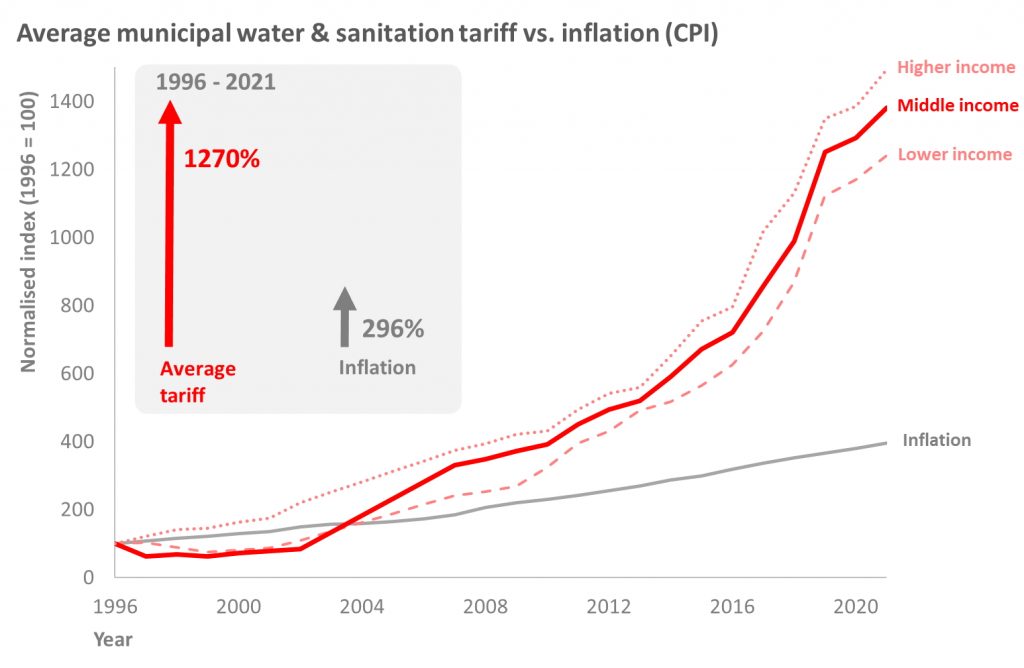
Average water consumption data for low, middle & high income households was obtained from References [2] and [3]. It was assumed that water consumption remained constant over time, although it is possible that it has reduced somewhat over the years due to increasing prices and water restrictions. However, the data in the references used ranged from 2004 to 2015 and water consumption was relatively constant over this period.
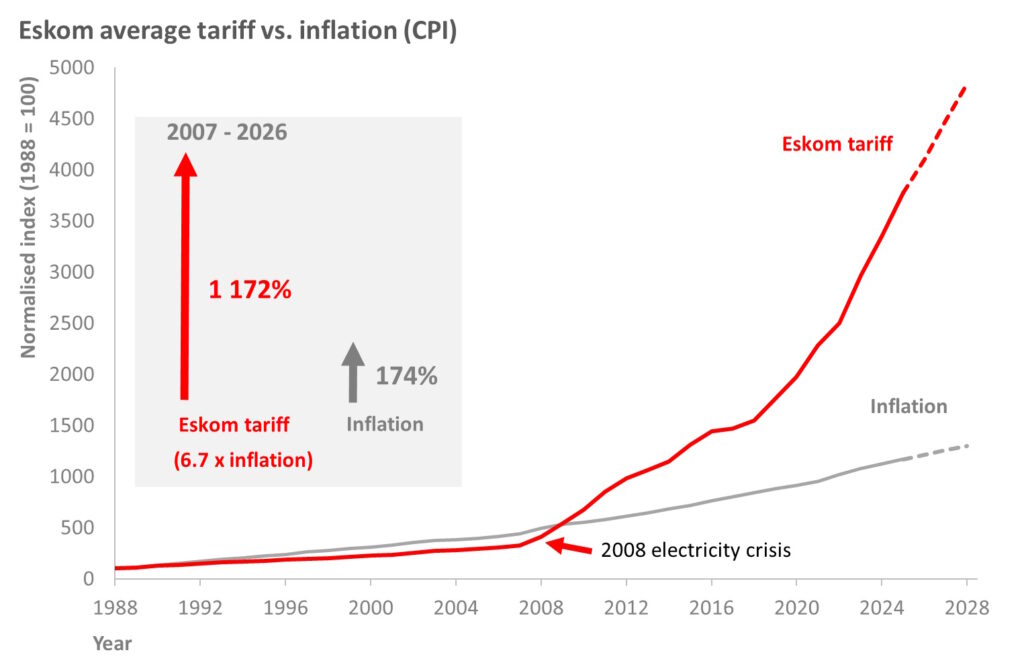
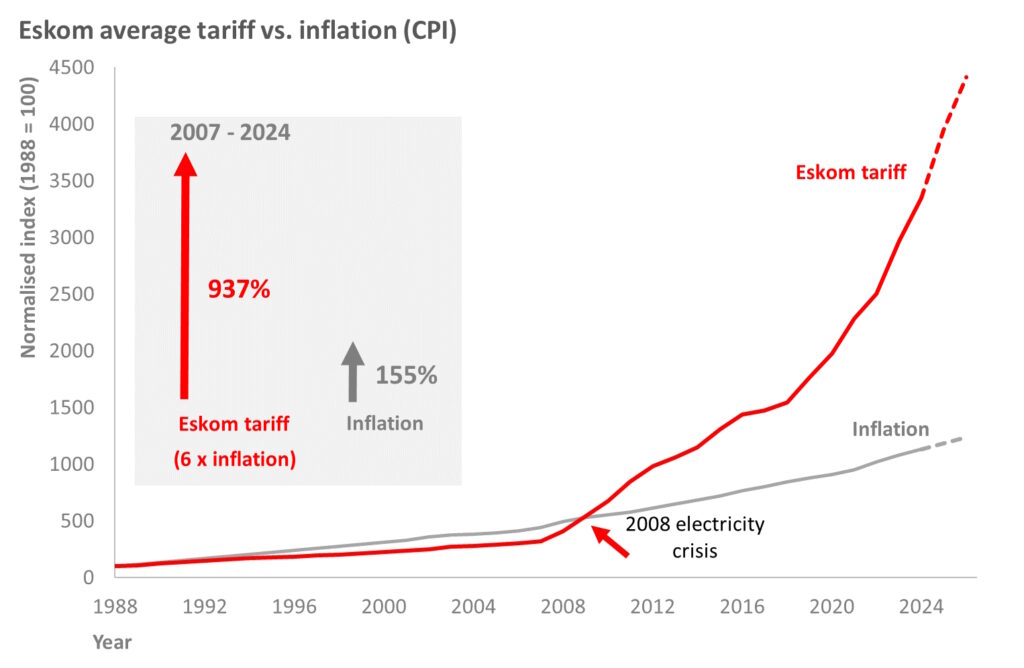
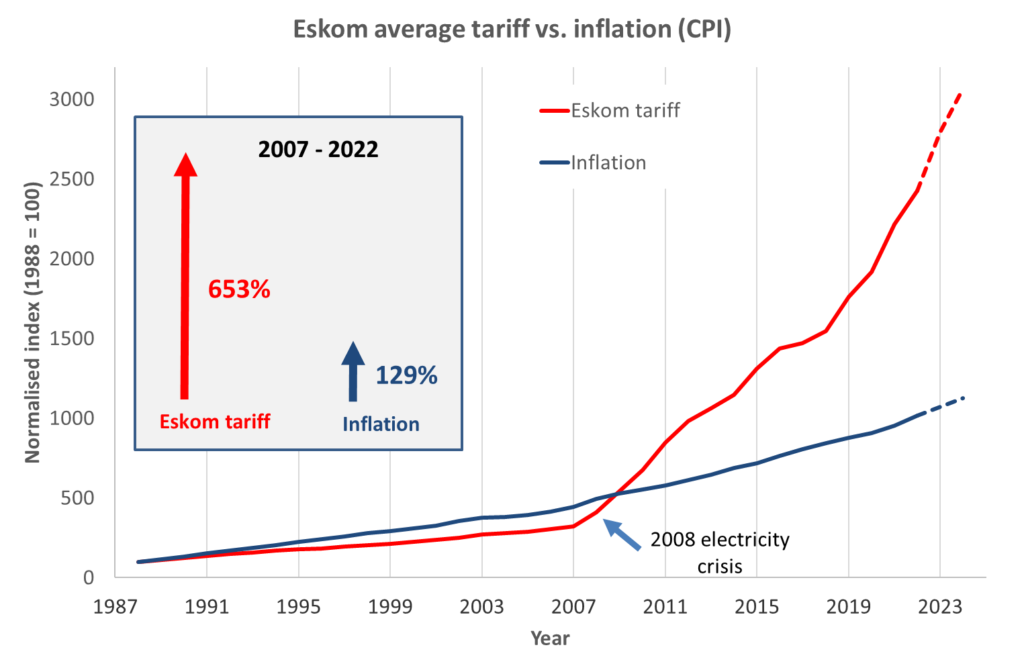
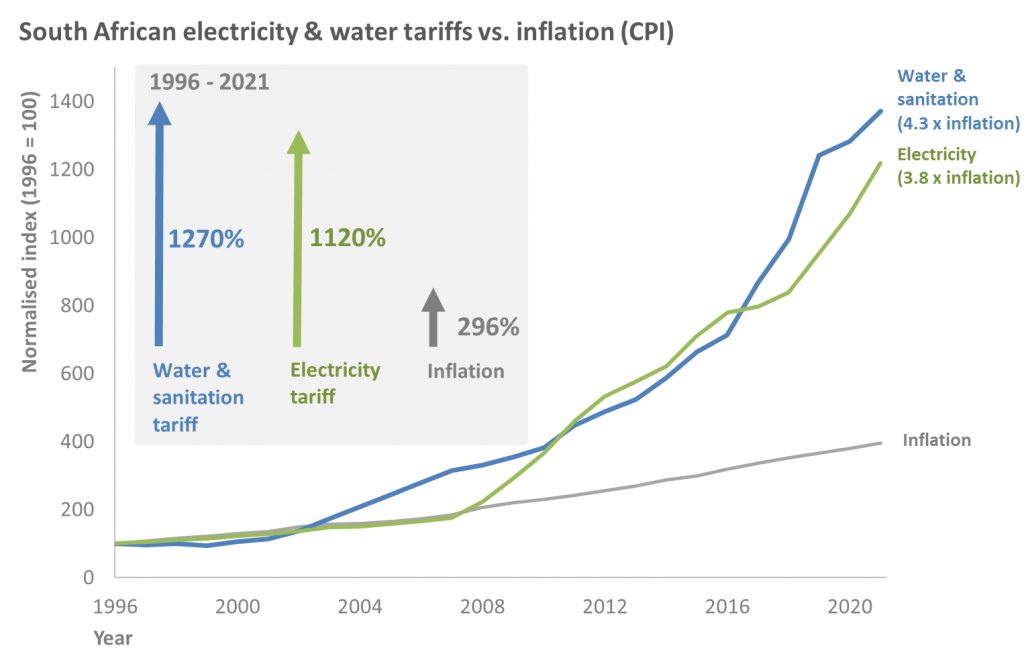
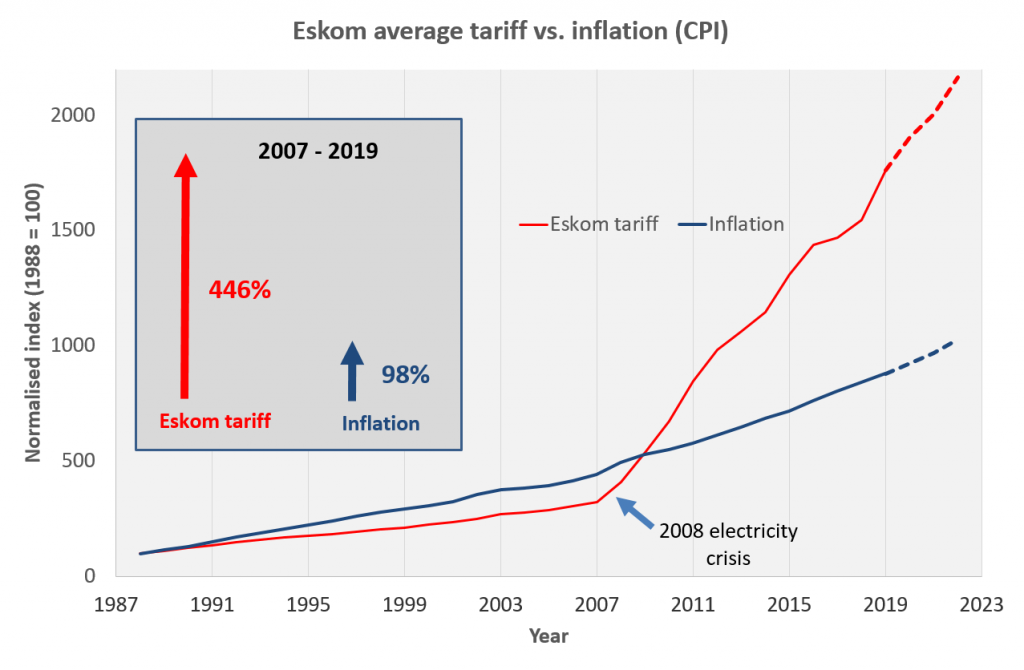
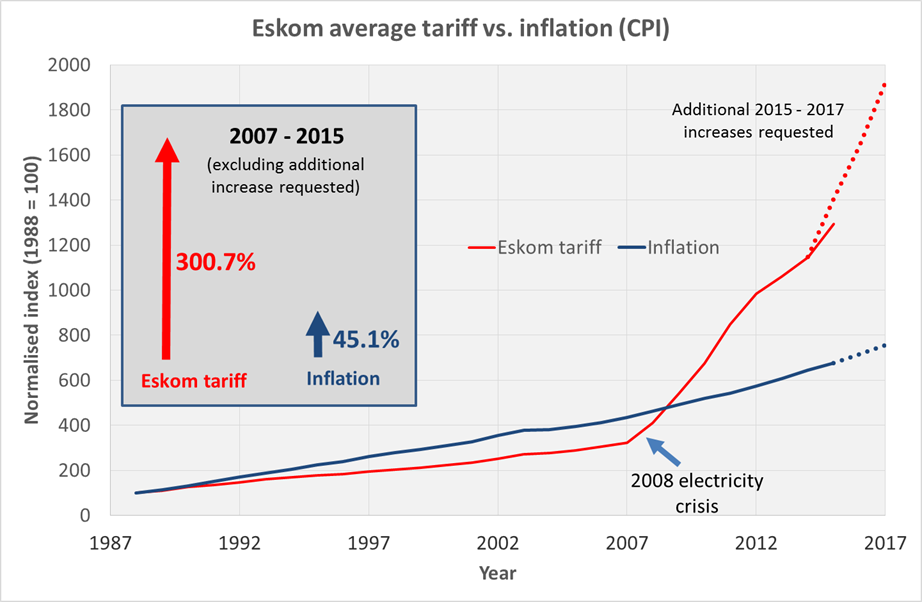
Eskom electricity tariff data were obtained from its website [4].
The Consumer Price Index (CPI) was used as inflation measure. CPI data was obtained from References [5], [6] and [7].
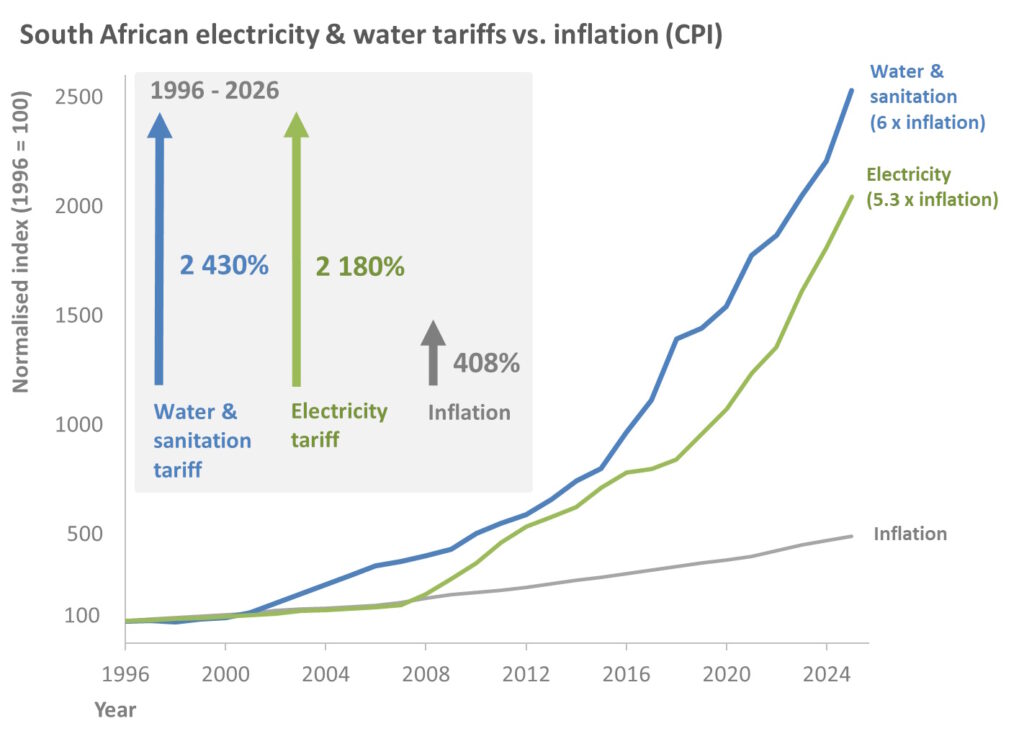
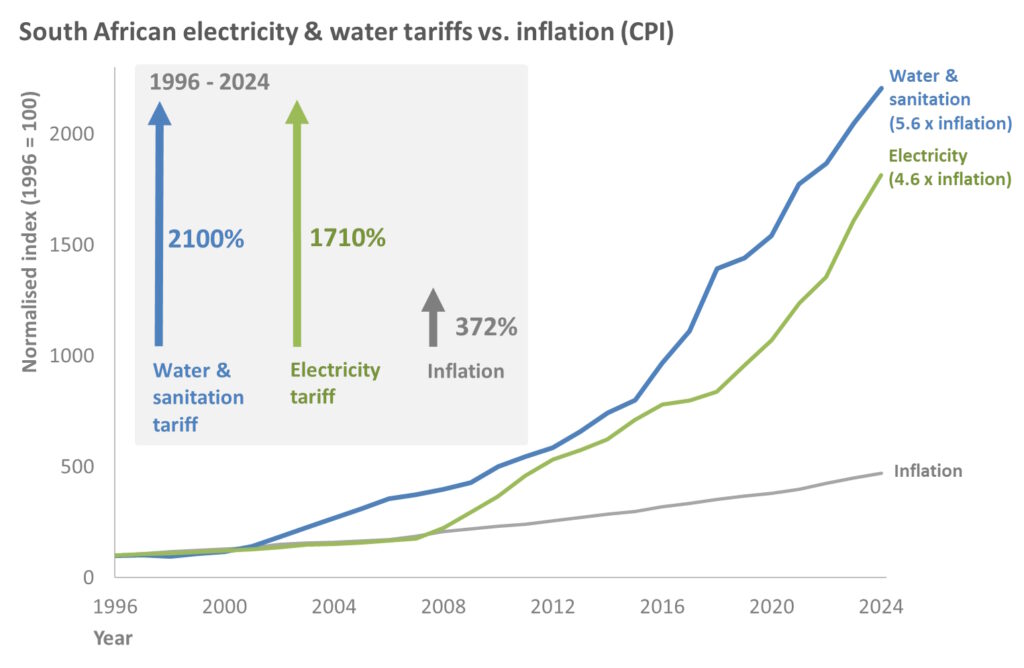
Municipal electricity and water & sanitation tariff data for the four metropolitan municipalities Cape Town, Johannesburg, Tshwane and eThekwini were obtained from their respective websites [8], [9], [10] and [11], as well as third-party reports [12].
Where water restrictions were in place and water restriction levels changed during the course of a municipal year (such as in Tshwane or Cape Town), the tariffs for the water restriction level that was in place for most of the year was used to calculate the average tariffs for the different income levels.
Tariffs for all income group were calculated based on the ‘single dwelling houses’ category and not for apartment buildings.
‘Indigent’ tariffs were not applied in calculation of the average tariffs for the lower income group (in other words, this group is not representative of the ‘lowest’ income group, but rather the ‘lower’ income group).
All tariffs are VAT inclusive.
All tariffs are metered tariffs (as opposed to prepaid tariffs). However, for most municipalities and in most years metered & prepaid tariffs are structured the same.
For the period 1996 to 2002, the water tariff data obtained excluded sanitation tariffs. The sanitation tariffs for this period for each of the four metro municipalities (Cape Town, Johannesburg, Tshwane and eThekwini) were estimated using the respective municipality’s average sanitation tariff as % of total water & sanitation tariff for later years for which full data was available.
Disposable income data was obtained from Reference [13].
No water & sanitation tariff data could be obtained for the four-year period 2003 to 2006. For this period, linear interpolation was done between the 2002 and 2007 tariffs for each municipality.
Average tariffs across the four metro municipalities in the study (Cape Town, Johannesburg, Tshwane and eThekwini) were calculated as simple averages (in other words, not weighted by measures such as population size).
[b] ‘Disposable income’ is defined as the total income after tax (in other words before expenses), not income after expenses.
[1]. Goliger, A. and Cassim, A. (14 and 15 July 2017). Tipping Points: The Impacts of Rising Electricity Tariffs on Households and Household Electricity Demand. 3rd Annual Competition and Economic Regulation (ACER) 2017 Conference, Dar es Salaam, Tanzania. Website: http://www.competition.org.za/s/Parallel-3B_Goliger-and-Cassim_National-Treasury.pdf. Last accessed: 2017/08/21.
[3]. Bailey WR, Buckley CA. 2004. Modelling Domestic Water Tariffs. Proceedings of the 2004 Water Institute of Southern Africa (WISA) Biennial Conference. Cape Town, South Africa, 2-6 May 2004. Website: https://wisa.org.za/wp-content/uploads/2018/12/WISA2004-P004.pdf. Last accessed 2020/08/02.
The graph below shows the Eskom tariffs from 1988 to 2019, plotted against CPI (Consumer Price Index) or inflation over the same period. It also shows projections up to 2022, based on currently projected increases as approved by NERSA (8.1% in 2020 and 5.2% in 2021), as well as Stats SA and the Bureau for Economic Research’s inflation projections.
Note: The graph depicts overall average increases – actual increases will be different for different types of consumers (residential, commercial and industrial) and will vary between municipalities.
Looking at the graph, the following can be noted:
In the period from 1988 up to the 2008 electricity crisis, electricity tariff increases did not keep tread with inflation. This was partly due to government policy to keep electricity tariffs as low as possible for poor communities, but also due to Eskom having an oversupply of electricity (in the 1990’s) and not investing in new capacity (in the 2000’s).
Between 1988 and 2007, electricity tariffs increased by 223%, whilst inflation over this period was 335%.
From the 2008 electricity crisis onwards, there is a clear and sharp inflection point for electricity tariffs in South Africa. From 2007 to 2019, electricity tariffs increased by 446%, whilst inflation over this period was98%. Thus electricity tariffs increased more than four-fold in 12 years.
Based on the currently approved increases for 2020 and 2021, the total increase in electricity tariffs from 2007 to 2021 will be 520%. By then, electricity tariffs would have increased more than5-fold in 14 years.
Considering the current serious state of Eskom’s debt and the fact that the country probably cannot afford for Eskom to fail, consumers can likely expect a continuance of much higher than inflation electricity price increases over the next several years. Eskom is in serious need of restructuring, but this is likely to face strong resistance from the trade unions.
PLEASE NOTE: This article is from 2015. Current status (2021): If financed via a home loan, solar PV plus storage is less expensive than buying electricity from your municipality in South Africa. According to this research by Sustainable Energy Africa, this was already the case in 2019 for middle-income households.
With the price of solar PV (photovoltaic) panels dropping by more than 10% per year, and Eskom seeking double digit increases for the foreseeable future, when can we expect to see the cost of residential solar PV and battery storage systems to drop below the cost of grid power from Eskom?
We did a simplified calculation to obtain an estimate of when this might happen… And it seems like it will start making financial sense for South Africans to switch within the next 3 years! Thereafter, the financial case for switching will just get stronger every year…
A major barrier to solar PV and battery storage systems is the upfront capital cost. But this could be financed by your bank, and you would be assured of a fixed electricity price for 20 years, compared to continually rising electricity costs if you are tied to the grid. Also, you would be completely free from loadshedding!
How we calculated:
We assumed a typical residential electricity usage of 900 kWh/month, at a current price of R1.40/kWh.
We estimated a current cost of a solar PV + battery storage solution to go off-grid at R200 000, plus an additional R30 000 for a solar geyser and gas oven.
We assumed a 10% increase in Eskom prices and a 10% decrease in solar PV + storage system prices per year. (This is conservative, as discussed above.)
We assumed a 20 year payback period and 10% interest rate on the loan to finance the solar PV + storage system.
Footnote: The graph plots the fixed monthly instalment that you would have to pay if you bought the system in the year as indicated. The instalments over the 20 year period would of course be constant. (So if you bought the system in 2015, fixed monthly instalment would be around R2 200/month over the 20 year period, whilst if you bought it in 2018, fixed monthly instalment would be around R1 600/month over the 20 year period.) Even if you bought the system right now (with the R2 200/month instalment), you will start saving by around 2020, meaning that for at least 15 years subsequently you will be paying less than what you would have if you were still on the grid (and every year the savings would increase due to the increasing price of electricity)…
Indeed! This brings us to the issue of load shedding.
Load shedding is when electricity supply is intentionally interrupted or reduced to avoid excessive load on the generating plants. Whilst it is very disruptive (as we all know!), it is preferable to a total collapse of the electricity supply grid, which will have disastrous consequences for the country. Should the demand be allowed to exceed the supply, it could very well happen and it would take a week or longer to get the grid online again.
2020 Update notes:
1. Please note that this article was written in 2015. Some of the recommendations might be outdated. For example, the price of lithium ion batteries have dropped dramatically since 2015 and have now become a viable alternative to lead acid batteries, with superior life, efficiency and general performance.
2. Please note that PowerOptimal does not sell or install inverter-based solar photovoltaic systems or battery backup systems. This article is provided for general information as a service to the public and not as marketing for our products. (We do manufacture and sell the Elon solar PV water heating system – this is a unit that allows direct connection of solar photovoltaic modules to a standard electric geyser, without an inverter.)
“If it weren’t for electricity we’d all be watching television by candlelight”
When a software glitch allowed such an imbalance to develop in 2003, the entire North-eastern and Midwestern United States and the Canadian Province of Ontario were blacked out, which left 55 million people without power for more than a week. A lack of alarms left operators unaware of the need to redistribute power after overloaded transmission lines hit unpruned foliage. Even in a technologically advanced country like the United States it can happen.
The first thing we need to realise is that load shedding will be part of our lives for several years to come. The second thing to realise is that it will get worse before it gets better. The next thing to realise is that we have no choice but to manage the situation according to our own specific needs.
Some of us could quite happily go without Sewende Laan, the Premier Soccer League and the Internet for several hours per week. For most of us though, a power failure not only spells inconvenience but a serious financial impact. Many small businesses face financial ruin. Business continuity is critical.
Backup power options for load shedding
If you cannot live with load shedding, your only alternative is to use stored energy when the lights go out and you really only have two choices, namely a generator or an inverter/ battery system.
What is an inverter? Basically it is an electronic or electrical device that changes DC (direct current) into AC (alternating current). It is required for when you want to use a battery storage system for backup power to your home or business, since the batteries deliver direct current and your devices / appliances run on alternating current.
In most cases, inverter/ battery systems offer superior performance and significant cost savings when compared to generators. Considering the efficiency of modern, solid state inverters, generators have definite drawbacks in several areas.
Most importantly, many body corporates, home owners associations, business parks and other landlords will not allow generators to be used. You can imagine the noise and smell when 200 generators start up in a complex.
The initial cost of a generator might be less expensive than an inverter system, but in the long run they are far more costly when you consider running costs and maintenance.Generators require constant attentionto assure proper operation. The oil needs to be changed regularly and other maintenance performed. It is also highly recommended that if a petrol generator does not run for more than 30 days, that the fuel is drained and the carburetor run dry. Nobody wants to go outside at night and perform a fault finding ritual when the generator fails to start.
Buying a cheap unknown brand of generator is penny wise and pound foolish. Very few are supported and even a minor unobtainable spare part could leave you in the dark once again. Connecting your expensive equipment to a unit with dubious or compromised circuitry may very well be a perilous exercise. Also, if you believe everything you read, better not read the spec sheets of some of the cheap imports.
With the ever increasing price of fuel, running a generator could become prohibitively expensive. And nobody likes the noise and fumes.
Fuel storage can be a nuisance as well. Apart from the fire hazard and regulatory problems, petrol cannot be stored for more than a month or so. You need to rotate your inventory on a regular basis to avoid problems.
An important consideration is the seamless transfer of power of the inverter system, which is impossible to achieve with a generator. Even with the fastest automatic and remote start facility, there will always be a delay of several seconds before the power comes on. By that time you might have lost important data on your computer or, even worse, you might have lost the plot of the soapie you were watching!
Having said all that about generators, an inverter/battery system is not the be all and end all of standby power. There are several disadvantages, like the energy storage limitations of the batteries as well as their expected life, which is generally between 5 and 7 years. Initial cost is an important consideration but it is for the most part justified by the preceding reasons.
Even more so than with generators, the bandwagon is overcrowded with opportunists looking to make a quick buck. If you are on a limited budget, rather buy a quality inverter of the size you prefer with fewer batteries initially. You can always add batteries later on but if you buy a 1 kW inverter with 3kW written on the package, you might as well go and play the lotto. At least you will have a chance of getting value for your money.
What about Solar, you may well ask. Well, the truth is that if all you are trying to do is bridge the gap between power outages, Solar is not the answer. The inverter/battery system does not generate anything. It simply stores and provides energy when needed. Significantly, mains power is still by far the cheapest energy you can buy today, in spite of the drastic Eskom price increases. If, however, you want to become less dependent on Eskom power, Solar might be an option but it is still very expensive. All the same, that is a discussion for another day.
What size inverter/battery system is appropriate for my household or small business?
1 to 3 kilowatt inverter/battery systems are the most popular for households and small businesses. Bigger systems generally require dedicated designs by competent engineers, so we will focus on the smaller systems.
Although it is technically possible to design a system that can pick up the entire electrical load of a household or business, it is totally impractical because of cost. Therefore high consumption items like geysers, washing machines, heaters and even kettles should be avoided to keep the size of the inverter down and limit the number of batteries. Since our aim is simply to survive load shedding, it is not too difficult to find alternatives for these energy guzzlers. Computers and TV sets do not do too well on candle power however!
To illustrate what is achievable, typical examples of the three most popular systems give a good idea of what is realistic. The figures in the tables below are approximate. The actual power consumption of your household appliances or office equipment may vary considerably from the figures in this table. Before you do a final load calculation, we strongly recommend using an electricity usage monitor to establish how much electricity an appliance is using. They are simple to use and cost around R750.
1 Kilowatt System
Rated at 1000 Watts, the system can typically back up the systems below. However, it does not mean that it can sustain the full load all the time. That will be like driving your car flat out all day long. A constant load of about 80% as depicted in the example is sensible.
The system now runs at 80% but a photo copier or fax machine, which operates for a limited time could be used in addition. Should you want to operate your garage door (750 Watts), some of the other loads will have to be turned off for a short time while the door operates. It will however, not accommodate boiling water in a kettle (±2000 Watts) because it is way above the system’s 1000 Watt rating.
Flat Screen TV DStv Decoder or PVR Stereo System Desktop Computer LCD Computer Monitor Modem Alarm System 5 Lights Total
Rated at 2000 Watts, the system can typically back up the systems below. Even though the total Wattage exceeds the 2000 Watt rating a maximum constant load of about 80% (i.e. 1.6 kW) is recommended. Some loads such as a microwave or printer are used for a short period only and will not put an excessive burden on the system.
You will obviously not use the microwave while something is being printed and it is a good idea to turn off the computer or the TV before using the microwave.
Flat Screen TV DStv Decoder or PVR Stereo System Desktop Computer LCD Computer Monitor Modem Alarm System 10 Energy Saver Lights Fridge Microwave Inkjet Printer Total
Rated at 3000 Watts, the system can sustain most household appliances with the exception of high power consumption items like the geyser, stove, washing machine, dryer, air conditioner etc. It will also keep a small office with several computers, printers, copiers etc. going. Typical use is depicted below.
Flat Screen TV DStv Decoder or PVR Stereo System Desktop Computer LCD Computer Monitor Modem Alarm System Surveillance Camera Electric Fence 4 Security Lights 10 Energy Saver Lights 15 LED Downlights 2 Bedside Lamps Alarm Clock Cell Phone / iPad / Laptop Charger Fridge Freezer Total
A number of the following appliances may be used, provided some of the loads are turned off to make provision for the higher consumption. The total consumption of 3000 Watts may be exceeded within limits for a short period because the inverter system has built in safety margins and will not be damaged. However, if the safety margins are exceeded the system will automatically turn off to protect itself. PowerOptimal’s Powerguard® Peak Demand Management system could be employed to manage these tasks automatically and will ensure that limits are never exceeded.
Microwave Toaster Vacuum Cleaner Electric Iron Inkjet Printer
What type of installation is appropriate for my inverter/battery system?
There are essentially three different ways of employing standby power systems. For 1 – 2 kW systems, it makes sense to use Version 1 or 2. From 3 kW and above, Version 3 with automatic switching could be a serious consideration. Systems larger than 5 kW require a site inspection and a dedicated design.
Version 1
The inverter and batteries are contained in a steel cabinet, which is fitted with a standard 15Amp plug outlet. Castors make the unit easily movable, but it is not designed as truly portable because the batteries are heavy and the weight could be considerable. It is typically used in the vicinity where it is required or with an
extension lead.
Version 2
The inverter unit is stored remotely and its output extended with its own cable via existing electrical conduit or surface mount to dedicated plug outlets that are completely isolated from the standard wiring. Potential problems with this solution are lack of space in the existing conduit or unsightly surface mounted cables.
Version 3
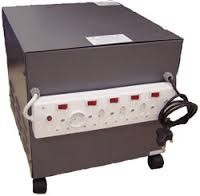
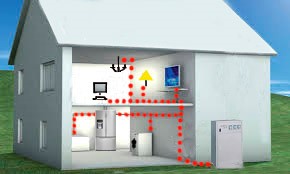
By employing the PowerGuard® DPM 30 – 8 Switcher, the inverter is permanently wired to the distribution board with minimal disruption during installation and present wiring remains untouched.
Unlike far too many risky installations, this perfectly legal connection complies with all regulations. Since it is impractical to use an inverter that is capable of picking up the full load, the PowerGuard® switcher ensures that high power consumption loads like the geyser and stove are turned off instantly during a power failure. With bigger units of 3kW and above, most other circuits like lights and plugs remain powered. Before installation, the client decides what should continue working during a power failure.
While we are on the topic of using existing wiring, a note of caution. Be very aware of wiring directly to your DB without a change over system that automatically and completely isolates the mains while running on the inverter. This is a serious fire hazard and while the electricity police will not come around and fine you, the insurance assessor will certainly take a keen interest in the wiring in the case of a fire damage claim.
What about battery types and sizes?
Although it is critical to use a high quality inverter capable of sustaining the design load, the batteries should also be of similar quality and of sufficient quantity. A bank of batteries with a combination of parallel and series connections provides the reservoir for the energy that has to be stored and later released when needed.
High performance lead acid batteries are usually used but they are not of the automotive type. While they are of similar construction, they are designed to withstand many more charge and discharge cycles and can also be deeply discharged. Known as a deep cycle battery, they can be cycled down to about 50% charge without incurring any damage. At that depth of discharge most of the potential energy had been extracted from the battery making them very useful for this application.
There are many varieties on the same theme ranging from the well known wet cell that requires regular maintenance to the more recently developed lead crystal with far superior performance and no maintenance whatsoever. As with all good things the superior performance naturally comes with a superior price.
The Sealed Maintenance Free Battery is reasonably priced and for that reason one of the more popular types. As the name suggests, it is to a large extent maintenance free, but the chemical reaction produces Hydrogen and Oxygen, which could form an explosive mixture. For that reason, these batteries cannot be used in a confined space and must be installed outside where it is well ventilated. They are generally about 35% cheaper than AGM batteries, which is the next step up.
In AGM (Absorbent Glass Mat) batteries, the electrolyte is mostly absorbed in glass fibre. This type of battery is entirely maintenance-free and there is no gas formation with normal use. Not requiring any ventilation, these batteries can be installed anywhere.
Batteries are rated in Amp Hour (Ah), which is a measurement of the amount of current it can supply over a certain period. They are rated over a period of 20 hours, which means a 100 Ah battery will supply 5 Amps over that period.
Simply put, the more Ah you have, the more capacity you have and the longer your system will produce power before the batteries run flat. To calculate the number of batteries required you may use the following rule of thumb. You need about one 100Ah battery per 1kW per hour. In other words if you have a 3kW system that should last for 4 hours you need 12 X 100 Ah batteries. 3 (3kW) X 4 (4 hours) = 12.
How can I contribute to reducing load shedding?
In spite of having alternatives for the times when the lights go out, all of us can contribute to limit load shedding to a minimum. We are in the middle of an energy crisis and each and every one of us needs to modify our lifestyles to accommodate this harsh reality. Here is what to do:
Switch off your geysers, electric heaters and pool pumps from 17h00 to 21h00 every day.
Switch off unnecessary appliances and lighting.
Consider alternative heating solutions (gas stoves, gas heaters, solar geysers, etc.).
Switch to CFL and LED lights.
Turn off anything that consumes standby energy (TVs, DVD players, computers, cell phone chargers).
Respond to the Power Alerts and Power Bulletin.
After all, saving electricity is a BRIGHT idea!
2020 Update notes:
1. Please note that this article was written in 2015. Some of the recommendations might be outdated. For example, the price of lithium ion batteries have dropped dramatically since 2015 and have now become a viable alternative to lead acid batteries, with superior life, efficiency and general performance.
2. Please note that PowerOptimal does not sell or install inverter-based solar photovoltaic systems or battery backup systems. This article is provided for general information as a service to the public and not as marketing for our products. (We do manufacture and sell the Elon solar PV water heating system – this is a unit that allows direct connection of solar photovoltaic modules to a standard electric geyser, without an inverter.)
Recently we learnt that Eskom has requested another 9.58% tariff increase from NERSA for 2015, on top of the 12.69% already approved for this year. More recently, it has emerged that Eskom is requesting what is called a “selective reopener” for 2016 and 2017 as well. In particular, it seems that Eskom is looking for an additional 9% increase in each of 2016 and 2017 – i.e. 17% increases in tariffs in both these years instead of 8%/year.
People know the power of compound interest (exponential growth!), and so it is interesting to have a look at where Eskom’s (effectively South Africa’s) electricity tariffs have come from and where they seem to be going.
The infographic below shows the Eskom tariffs from 1988 to 2015, plotted against CPI (Consumer Price Index) or inflation over the same period. It also shows projections up to 2017, based on the additional increases requested by Eskom, and based on SARB’s inflation projections.
Note: The infographic depicts overall average increases – actual increases will be different for different types of consumers (residential, commercial and industrial) and will vary between municipalities.
Looking at the graph, the following can be noted:
In the period from 1988 up to the 2008 electricity crisis, electricity tariff increases did not keep tread with inflation. This was partly due to government policy to keep electricity tariffs as low as possible for poor communities, but also due to Eskom having an oversupply of electricity (in the 1990’s) and not investing in new capacity (in the 2000’s).
Between 1988 and 2007, electricity tariffs increased by 223%, whilst inflation over this period was 335%.
From the 2008 electricity crisis onwards, there is a clear and sharp inflection point for electricity tariffs in South Africa. From 2007 to 2015, electricity tariffs increased by 300%, whilst inflation over this period was45%. Thus electricity tariffs tripled in 8 years.
If the additional increase for 2015 (another 9.58% on top of the 12.69% already approved by NERSA) is approved, this will mean that the total increase in electricity tariffs from 2007 to 2015 would be 335%.
If the additional increases for 2016 & 2017 (another 9%/yr on top of the 8%/yr already approved by NERSA) are approved, this will mean that the total increase in electricity tariffs from 2007 to 2017 would be 495%, compared to 74% for inflation over the same period. Thus electricity tariffs would have increased 5-fold in 10 years.
We need to keep in mind that SA’s electricity is still not very expensive when compared to the rest of the world or even Africa. E.g. in 2014, Uganda, Namibia and Ghana had tariffs more than double that of South Africa. However, the problem is that the South African economy has structured itself around cheap electricity, and it will be costly to change the way things are done (behaviour) and change over to more energy-efficient infrastructure.
The SAIRR recently published a report projecting that Eskom will have another 18 000 MW supply shortfall by 2030, if our GDP grows by 3%/yr. This is in addition to Medupi, Kusile and Ingula. (See this Fin24 summary of the report.) To add insult to injury, Standard & Poor’s has just downgraded Eskom to junk status.
Considering the above, it is safe to say that we can expect to see over the next several years: (a) a continuation of the current electricity supply shortages (read: load shedding); and (b) higher-than-inflation electricity price increases. We will all need to start thinking about how we can contribute to reducing demand and minimising the impact of the supply constraints.