In 2021, we published an analysis of municipal water & electricity tariff increases compared to inflation since 1996.Â
That analysis revealed a shocking reality: the average price of both water & electricity across the four largest South African municipalities increased about four times faster than inflation.
This was a sad state of affairs in a country where a large part of the population lives in poverty.
The question is: have things improved or deteriorated further since 2021?
To answer this question, we have updated the analysis with data up to 2024. The result is shown in the graph below.
Note: The graph depicts overall average increases for residential consumers – actual increases will be different for different types of consumers (residential, commercial and industrial) and will vary between municipalities.
Looking at the graph, the following can be noted:
Both water and electricity tariffs have increased dramatically faster than inflation over the period 1996 to 2024.
In fact, water tariffs have increased even faster than electricity tariffs, despite the electricity tariff increases receiving a lot more negative attention from the press and consumers.
Over the period 1996 to 2024, electricity tariffs increased almost 5 times faster than inflation and water tariffs increased almost 6 times faster than inflation.
The unfortunate conclusion is that the unsustainable trend of much higher than inflation increases in the price of water & electricity by municipalities has continued over the past three years.
In 2015, 2017, 2019 and 2022 we published infographics showing Eskom annual tariff increases since 1988 compared to inflation.
Eskom tariffs increased by an eye-watering 18.7% in 2023 and again by a painful 12.7% in 2024. This compares to CPI (Consumer Price Index) increases of 5.9% and 4.9% over the same two-year period.
The graph below shows the Eskom tariffs from 1988 to 2024, plotted against CPI (Consumer Price Index) or inflation over the same period. It also shows projections up to 2026, based on inflation projections and Eskom’s planned applications to NERSA (and assuming NERSA only grants half their requested increase of 36.15% for 2025).
Note: The graph depicts overall average increases – actual increases will be different for different types of consumers (residential, commercial and industrial) and will vary between municipalities.
Looking at the graph, the following can be noted:
In the period from 1988 up to the 2008 electricity crisis, electricity tariff increases did not keep tread with inflation. This was partly due to government policy to keep electricity tariffs as low as possible for poor communities, but also due to Eskom having an oversupply of electricity (in the 1990’s) and not investing in new capacity (in the 2000’s).
Between 1988 and 2007, electricity tariffs increased by 223%, whilst inflation over this period was 335%.
From the 2008 electricity crisis onwards, there is a clear and sharp inflection point for electricity tariffs in South Africa. From 2007 to 2024, electricity tariffs increased by 937%, whilst inflation over this period was 155%. Thus, electricity tariffs increased six-fold (or SIX times faster than inflation) in real money terms in 16 years.
Eskom plans to apply for another 36.15% increase in 2025, so unfortunately it seems the dramatic increases in electricity prices are likely to continue.
In 2015, 2017 and 2019 we published infographics showing Eskom annual tariff increases since 1988 compared to inflation.
Following Eskom’s court order success against NERSA in early 2021, it increased electricity prices by an average of 15.63% in April 2021. In April 2022, a further increase of 9.61% was approved. So what do the numbers look like today?
The graph below shows the Eskom tariffs from 1988 to 2022, plotted against CPI (Consumer Price Index) or inflation over the same period. It also shows projections up to 2024, based on expert forecasts and inflation projections.
Note: The graph depicts overall average increases – actual increases will be different for different types of consumers (residential, commercial and industrial) and will vary between municipalities.
Looking at the graph, the following can be noted:
In the period from 1988 up to the 2008 electricity crisis, electricity tariff increases did not keep tread with inflation. This was partly due to government policy to keep electricity tariffs as low as possible for poor communities, but also due to Eskom having an oversupply of electricity (in the 1990’s) and not investing in new capacity (in the 2000’s).
Between 1988 and 2007, electricity tariffs increased by 223%, whilst inflation over this period was 335%.
From the 2008 electricity crisis onwards, there is a clear and sharp inflection point for electricity tariffs in South Africa. From 2007 to 2022, electricity tariffs increased by 653%, whilst inflation over this period was 129%. Thus, electricity tariffs increased four-fold (or quadrupled) in real money terms in 14 years.
Considering the current serious state of Eskom’s debt and the fact that the country probably cannot afford for Eskom to fail, consumers can likely expect a continuance of much higher than inflation electricity price increases over the next several years.
In fact, Eskom has already applied to NERSA for a 32% tariff increase in April 2023. It has also applied to NERSA to restructure residential tariffs to ‘reflect cost drivers more accurately’. The restructured tariffs will see two main options for direct Eskom customers – Homepower and Homeflex.Â
For the Homepower tariff, the grid connection fee would increase from R218/month to R938/month – this is the charge before you have used a single kWh of electricity!
The Homeflex tariff will introduce time-of-use charges – in other words, the price of electricity will change depending on the time of day. (Time-of-use charges is widespread internationally, and helps to balance grid load by incentivising electricity use outside of peak hours.)
Eskom is in serious need of restructuring – which the government at last acknowledged and announced in 2019. As of October 2022 this restructuring has not yet been completed, but is in progress.
PowerOptimal, a leader in innovative sustainable energy and demand management solutions, has announced that it has partnered with the South African subsidiary of Swedish global appliance giant Electrolux, to bring cost-effective, sustainable solar photovoltaic (PV) water heating solutions to the South African market.
Â
This exclusive partnership will see the PowerOptimal’s Elon solar PV water heating technology sold alongside Electrolux’s leading Kwikot Superline electric water heaters (geysers). With deployment of the PowerOptimal Elon range, a customer can add solar capability to most standard electric geysers, without the need for an inverter or battery. It is the most straightforward and most convenient means to take advantage of solar and traditional power in an existing solution.
“We are very pleased to announce our partnership with PowerOptimal. The company’s sustainable energy solutions align perfectly with our global commitment to sustainability, which is to shape living for the better”, states Mark Moyce, National Sales & Marketing Director at Electrolux South Africa. “By including the Elon into our range of water heating solutions, we are offering developers, builders and all users of geysers a means to take advantage of the abundant solar resource we have in this country at a fraction of the cost.”
According to both parties the partnership makes perfect sense, as the organisations are an excellent cultural fit, the technologies integrate seamlessly, and the technical excellence from both are providing a superior technology solution designed to support and grow mass adoption of sustainable energy.
The innovative PowerOptimal Elon range enables direct connection of solar PV panels to standard electric geysers. It requires no inverter and no batteries, is cost-effective, offers a long lifespan and requires almost no maintenance, making it one of the lowest cost per unit of energy (kWh) solutions for water heating available on the market today.
“We are honoured to partner with Electrolux. The company’s market coverage, quality standards, and market-leading customer service make them the perfect partner for our Elon solution,” states Richard Fearon, CEO at PowerOptimal. “Through this exclusive partnership, all PowerOptimal water heating solutions will be recommended and exclusively sold by Electrolux in South Africa. Together we are looking forward to leveraging the technical capabilities of both companies to bring sustainable energy to a larger market of people, previously inhibited by the sheer cost of solar PV technology.”
PowerOptimal’s Elon range solution can run entirely off the grid, or with grid AC power as backup. In addition, it can be used by property developers for conformance to SANS 10400-XA’s Regulation XA2, which requires that at least 50% of the annual water heating requirement for all new buildings shall be from a source other than grid electricity.
###
About PowerOptimal
PowerOptimal designs, develops and builds sustainable energy solutions that redefine the future of energy. Headquartered in South Africa and founded in 2014, PowerOptimal’s team draws from their collective engineering and commercial expertise to enable global organisations and consumers to reduce energy cost whilst achieving the sustainability goal of net zero carbon. The company’s innovative and patented energy demand management and solar photovoltaic water heating systems are designed to reduce consumption, demand and cost by leveraging the abundant solar resource.

The graph below shows the Eskom tariffs from 1988 to 2019, plotted against CPI (Consumer Price Index) or inflation over the same period. It also shows projections up to 2022, based on currently projected increases as approved by NERSA (8.1% in 2020 and 5.2% in 2021), as well as Stats SA and the Bureau for Economic Research’s inflation projections.
Note: The graph depicts overall average increases – actual increases will be different for different types of consumers (residential, commercial and industrial) and will vary between municipalities.
Looking at the graph, the following can be noted:
In the period from 1988 up to the 2008 electricity crisis, electricity tariff increases did not keep tread with inflation. This was partly due to government policy to keep electricity tariffs as low as possible for poor communities, but also due to Eskom having an oversupply of electricity (in the 1990’s) and not investing in new capacity (in the 2000’s).
Between 1988 and 2007, electricity tariffs increased by 223%, whilst inflation over this period was 335%.
From the 2008 electricity crisis onwards, there is a clear and sharp inflection point for electricity tariffs in South Africa. From 2007 to 2019, electricity tariffs increased by 446%, whilst inflation over this period was 98%. Thus electricity tariffs increased more than four-fold in 12 years.
Based on the currently approved increases for 2020 and 2021, the total increase in electricity tariffs from 2007 to 2021 will be 520%. By then, electricity tariffs would have increased more than 5-fold in 14 years.
Considering the current serious state of Eskom’s debt and the fact that the country probably cannot afford for Eskom to fail, consumers can likely expect a continuance of much higher than inflation electricity price increases over the next several years. Eskom is in serious need of restructuring, but this is likely to face strong resistance from the trade unions.
One thing is certain: the energy industry is undergoing rapid and dramatic change, and mostly to our collective benefit!
There are too many developments to mention, but here are a few of the most interesting from the last few weeks:
The UK (2040) and France (2040) have both joined Germany (2030), Norway (2025), the Netherlands (2025) and India (203) in announcing plans to completely ban petrol & diesel vehicle sales. This is driven partly by renewable energy and climate change goals, but the main concern is actually nitrogen oxide pollution and its negative health effects on urban populations.
These developments will provide further impetus to the growth of electric vehicle sales. Bloomberg New Energy Finance predicts that over half of all new car sales will be electric by 2040. They also predict that electric vehicles will cost less than internal combustion engine vehicles by 2025 – 2029 in most countries.
That should make Tesla’s shareholders happy! What is also making them happy, is Tesla securing an order from South Australia for the world’s largest lithium ion battery of 100 MW. The battery will be paired with a Neoen wind farm.
Speaking of wind farms, it seems that two-bladed wind turbines are much more cost-effective than three-bladed turbines. A slightly lower efficiency (about 2% lower) is more than off-set by an approximately 50% reduction in total cost of energy (capital & operating cost) over the lifetime!
And a floating wind farm has been proposed off California’s coast, where a steep continental shelf makes traditional underwater foundations for offshore wind farms prohibitively expensive.
Fossil fuel power generation continues to experience headwinds. A large Mississippi flagship clean coal project is experiencing large cost overruns (their US$2.4bn budget is heading to US$7bn!), putting the feasibility of clean coal in question.
The fact that even in the USA coal and nuclear power projects continue to experience huge cost overruns should be a major red flag for South Africa’s nuclear power plant ambitions. Let’s hope that the powers that be start accepting our inevitable solar future!
Until next time
The PowerOptimal team
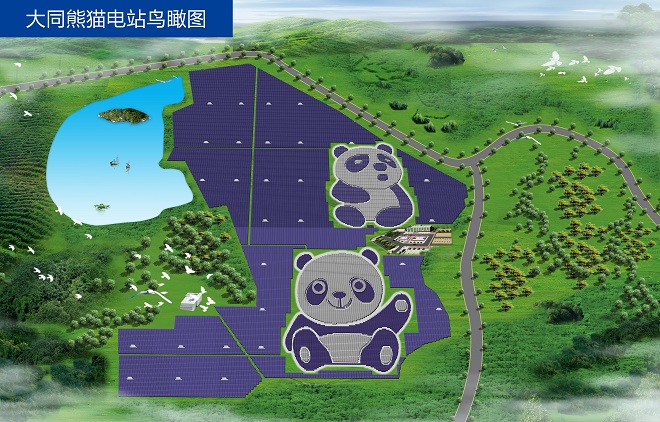
Image below: China’s Panda Green Energy Group has been creative with a new 100 MW solar farm…
Recently we learnt that Eskom has requested another 9.58% tariff increase from NERSA for 2015, on top of the 12.69% already approved for this year. More recently, it has emerged that Eskom is requesting what is called a “selective reopener” for 2016 and 2017 as well. In particular, it seems that Eskom is looking for an additional 9% increase in each of 2016 and 2017 – i.e. 17% increases in tariffs in both these years instead of 8%/year.
Â
People know the power of compound interest (exponential growth!), and so it is interesting to have a look at where Eskom’s (effectively South Africa’s) electricity tariffs have come from and where they seem to be going.
The infographic below shows the Eskom tariffs from 1988 to 2015, plotted against CPI (Consumer Price Index) or inflation over the same period. It also shows projections up to 2017, based on the additional increases requested by Eskom, and based on SARB’s inflation projections.
Note: The infographic depicts overall average increases – actual increases will be different for different types of consumers (residential, commercial and industrial) and will vary between municipalities.
Looking at the graph, the following can be noted:
In the period from 1988 up to the 2008 electricity crisis, electricity tariff increases did not keep tread with inflation. This was partly due to government policy to keep electricity tariffs as low as possible for poor communities, but also due to Eskom having an oversupply of electricity (in the 1990’s) and not investing in new capacity (in the 2000’s).
Between 1988 and 2007, electricity tariffs increased by 223%, whilst inflation over this period was 335%.
From the 2008 electricity crisis onwards, there is a clear and sharp inflection point for electricity tariffs in South Africa. From 2007 to 2015, electricity tariffs increased by 300%, whilst inflation over this period was 45%. Thus electricity tariffs tripled in 8 years.
If the additional increase for 2015 (another 9.58% on top of the 12.69% already approved by NERSA) is approved, this will mean that the total increase in electricity tariffs from 2007 to 2015 would be 335%.
If the additional increases for 2016 & 2017 (another 9%/yr on top of the 8%/yr already approved by NERSA) are approved, this will mean that the total increase in electricity tariffs from 2007 to 2017 would be 495%, compared to 74% for inflation over the same period. Thus electricity tariffs would have increased 5-fold in 10 years.
We need to keep in mind that SA’s electricity is still not very expensive when compared to the rest of the world or even Africa. E.g. in 2014, Uganda, Namibia and Ghana had tariffs more than double that of South Africa. However, the problem is that the South African economy has structured itself around cheap electricity, and it will be costly to change the way things are done (behaviour) and change over to more energy-efficient infrastructure.
The SAIRR recently published a report projecting that Eskom will have another 18 000 MW supply shortfall by 2030, if our GDP grows by 3%/yr. This is in addition to Medupi, Kusile and Ingula. (See this Fin24 summary of the report.) To add insult to injury, Standard & Poor’s has just downgraded Eskom to junk status.
Considering the above, it is safe to say that we can expect to see over the next several years: (a) a continuation of the current electricity supply shortages (read: load shedding); and (b) higher-than-inflation electricity price increases. We will all need to start thinking about how we can contribute to reducing demand and minimising the impact of the supply constraints.