2026 update: Eskom tariff increases vs inflation since 1988 (with projections to 2028)
02Mar
by Sean Moolman
0
In 2015, 2017, 2019, 2022 and 2024 we published infographics showing Eskom annual tariff increases since 1988 compared to inflation.
Eskom tariffs again increased by substantially more than inflation in 2025, with an average increase of 12.74%. This compares to a CPI (Consumer Price Index) increase of 3.79% over the same year.
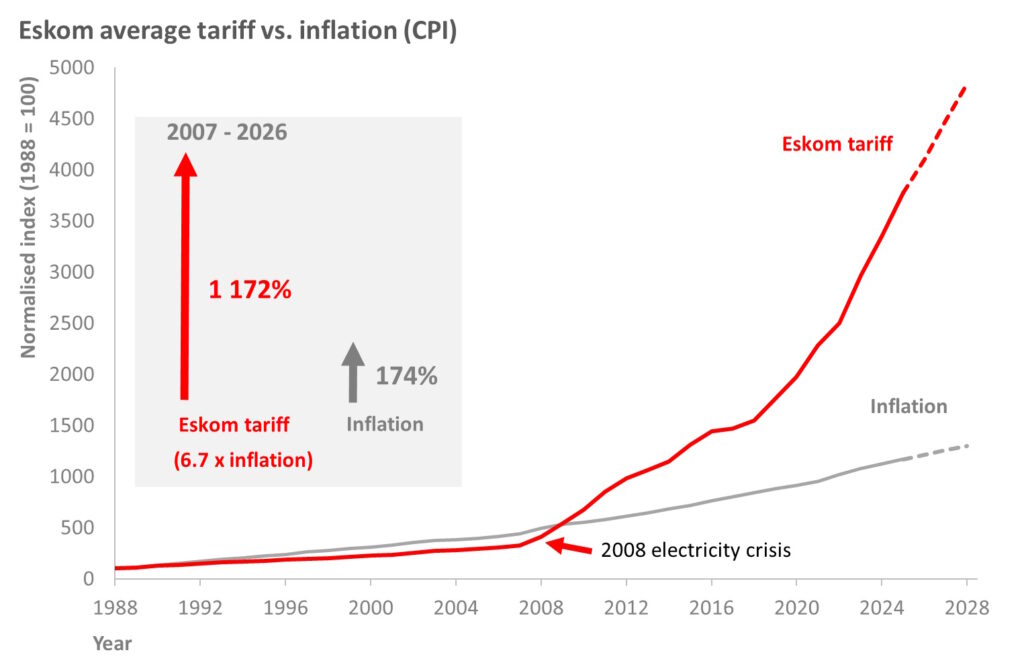
The graph below shows the Eskom tariffs from 1988 to 2026, plotted against CPI (Consumer Price Index) or inflation over the same period. It also shows projections up to 2028, based on inflation projections and Eskom’s already approved increases of 8.76% in 2026 and 9.19% in 2027.
Note: The graph depicts overall average increases – actual increases will be different for different types of consumers (residential, commercial and industrial) and will vary between municipalities.
Looking at the graph, the following can be noted:
In the period from 1988 up to the 2008 electricity crisis, electricity tariff increases did not keep tread with inflation. This was partly due to government policy to keep electricity tariffs as low as possible for poor communities, but also due to Eskom having an oversupply of electricity (in the 1990’s) and not investing in new capacity (in the 2000’s).
Between 1988 and 2007, electricity tariffs increased by 223%, whilst inflation over this period was 335%.
From the 2008 electricity crisis onwards, there is a clear and sharp inflection point for electricity tariffs in South Africa. From 2007 to 2026, electricity tariffs increased by 1 172%, whilst inflation over this period was174%. Thus, electricity tariffs increased more than six-fold (or SIX times faster than inflation) in real money terms in 18 years.
Based on the already-approved increases of 8.76% in 2026 and 9.19% in 2027, these above-inflation increases are unfortunately set to continue.